RNA-Seq Data Analysis: A Step-by-Step Overview
Introduction
When conducting RNA-Seq analysis using next-generation sequencers, raw data known as FASTQ files are generated. Various data processing steps are required to perform the quantification of gene expression, identification of differentially expressed genes(DEGs), and functional enrichment analysis of DEGs (such as gene ontology analysis and pathway analysis) starting from this raw data.
This page provides a step-by-step guide for analyzing RNA-Seq data from raw data for species with well-annotated genomes, such as humans, mice, and rats.
Overview of Data Analysis Process
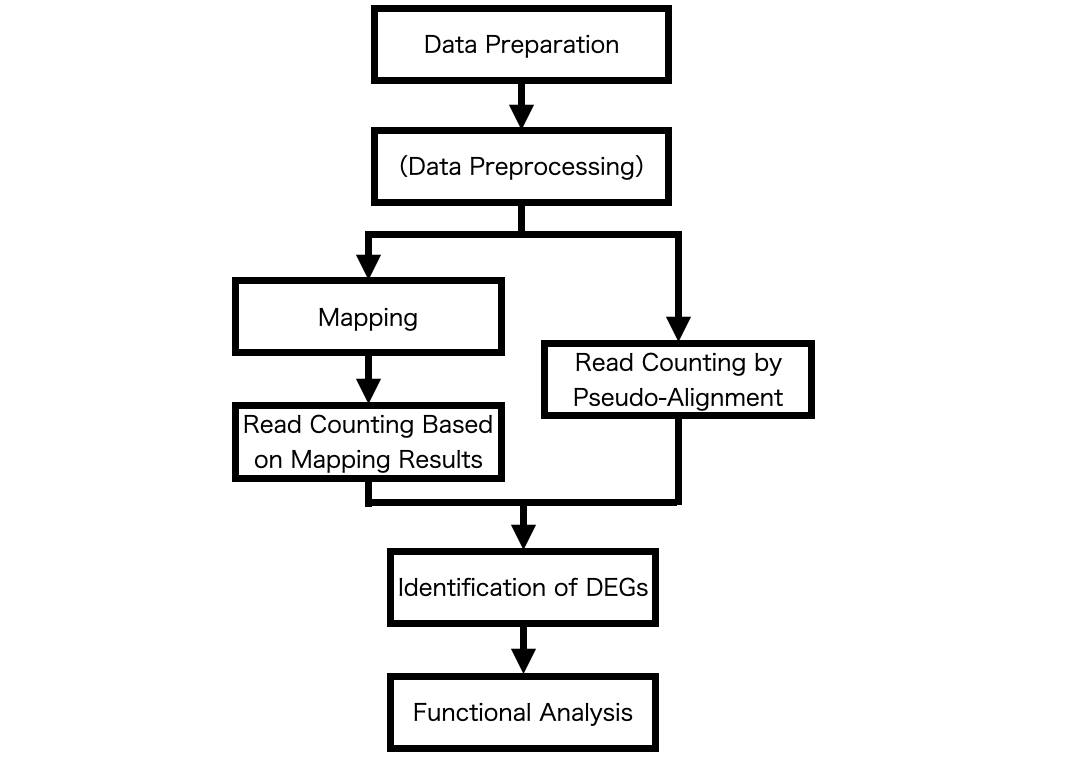
List of Steps
| Steps | Overview |
|---|---|
| Data Preparation | Prepare the FASTQ files for analysis. |
| Data Preprocessing | Trim adapter sequences from FASTQ files and filter out low-quality reads. |
| Mapping | Finding the original location of a read in the reference genome. |
| Read Counting Based on Mapping Results | Count the number of reads mapped to each gene, based on the mapping results. |
| Read Counting by Pseudo-Alignment | Count the number of reads mapped to each gene, based on the FASTQ files. |
| Identification of Differentially Expressed Genes (DEGs) | Identify genes with changes in expression levels under different conditions or between groups. |
| Functional Enrichment Analysis (Gene Ontology Analysis and Pathway Analysis) | Clarify the functions that the genes are involved in. |
Data Preparation
First, it is necessary to prepare the FASTQ files to be used for data analysis. FASTQ files can be obtained through sequencing with next-generation sequencers. You may either conduct the sequencing yourself or outsource it. It is also possible to download FASTQ files from public databases. In such cases, it is recommended to use a tool such as fasterq-dump.
Related Pages
Data Preprocessing
Raw data output from next-generation sequencers may contain reads with adapter sequences and low-quality reads. Therefore, it's often beneficial to preprocess the FASTQ files by trimming adapter sequences and filtering out low-quality reads.
Commonly used software for preprocessing FASTQ files includes Trimmomatic, Cutadapt, FastQC, and fastp.
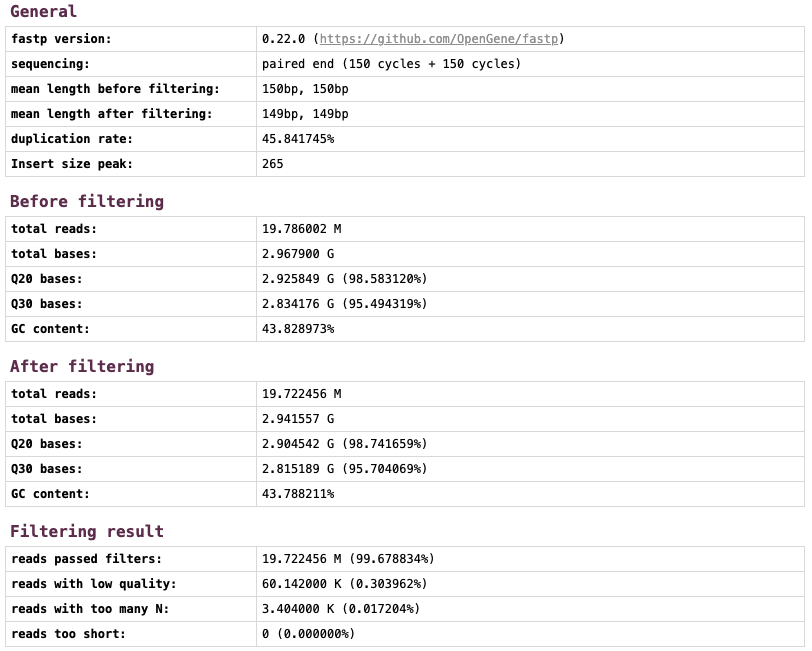
An example of the results after preprocessing using fastp is provided below. The data, initially comprising 19,786,002 reads and 2,967,900,000 bases, was processed to 19,722,456 reads and 2,941,557,000 bases.
Result of Data Preprocessing
Related Pages
Mapping
Next, the reads obtained from the next-generation sequencer are mapped to a reference genome. Mapping refers to the analysis of finding the original location of a read in the reference genome. The results of the mapping are produced in a format known as a BAM file. Thus, mapping can be described as the analysis that takes FASTQ files and a reference genome as inputs and produces a BAM file.
Commonly used software for mapping includes HISAT2, STAR, and Bowtie2.
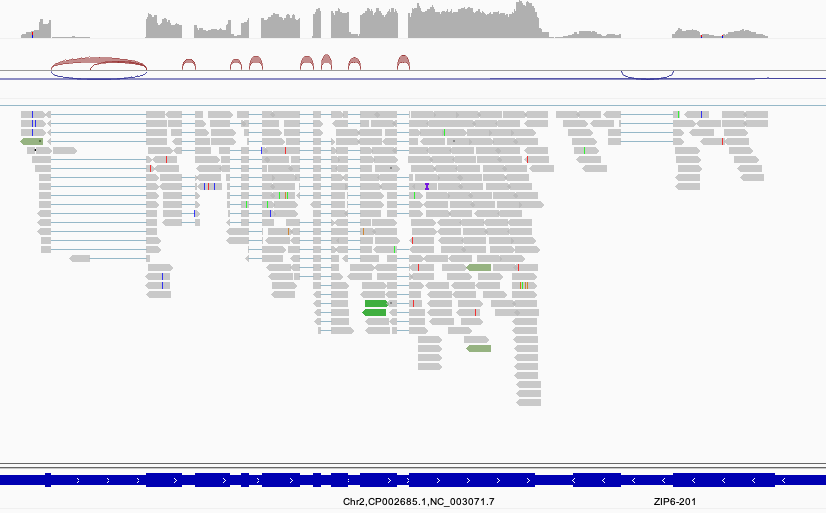
An example of the visualization of the mapping results is provided below.
Result of Mapping
Read Counting Based on Mapping Results
Next process is counting the number of reads mapped to each gene based on the mapping results. This process utilizes the reference genome and annotation files (such as GTF or GFF3 files), as well as the mapping results (BAM file).
Commonly used software for counting reads based on mapping results includes featureCounts, htseq-count, RSEM, and StringTie. If the analysis aims for read counting at the gene level, tools like featureCounts and htseq-count are sufficient. However, when transcript-level counting is required, tools such as RSEM or StringTie are utilized.
An example of the read counting results is provided below.
Result of Read Count

Related Pages
Read Counting by Pseudo-Alignment
In addition to the traditional method of read counting based on mapping results, there is also the option of using a process known as pseudoalignment mapping for counting reads. This approach eliminates the need for prior mapping. Instead, it generates read counting results directly from the FASTQ files and the reference transcriptome.
Software commonly used for pseudoalignment mapping includes Salmon and Kallisto.
The read counting results from pseudoalignment mapping are essentially equivalent to those obtained from mapping-based read counting.
Result of Read Count

Identification of Differentially Expressed Genes
The process of identifying differentially expressed genes (DEGs) involves finding genes that exhibit significantly increased or decreased expression levels under different conditions or between groups. DEGs can be identified based on read counting results.
Software commonly used for identifying DEGs includes Ballgown, edgeR, and DESeq2.
An example of the results from identifying differentially expressed genes (DEGs) is provided below.
Results of Differentially Expressed Gene Identification

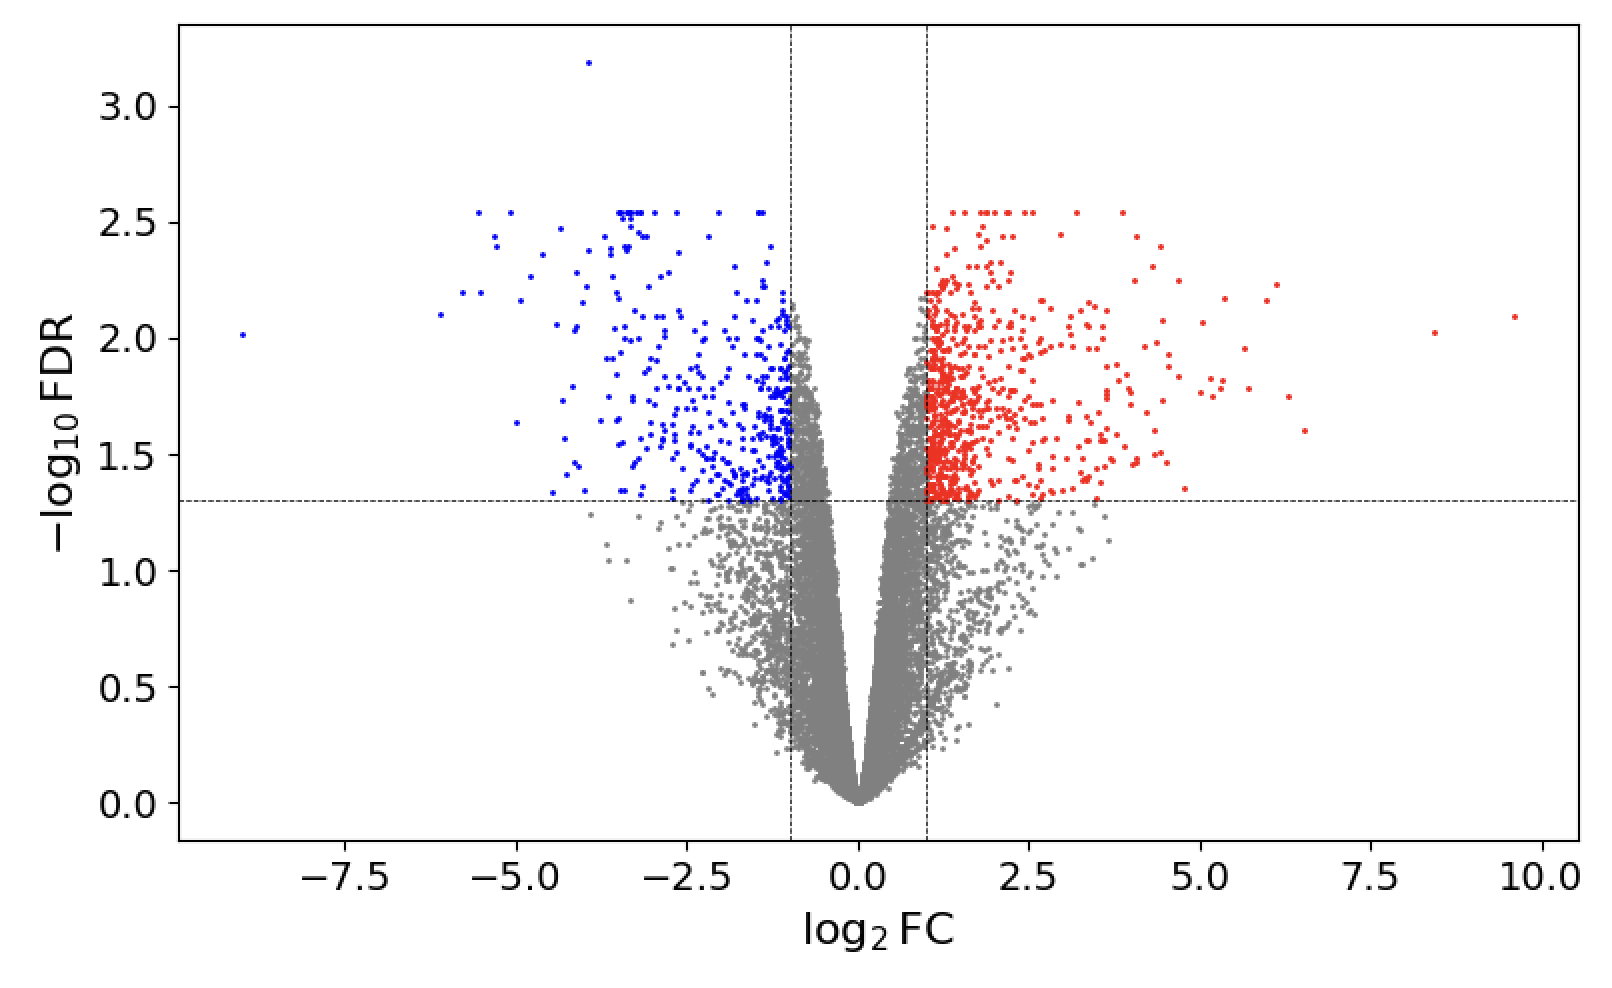
The results of the identification of differentially expressed genes are sometimes visualized using figures such as a heatmap and a volcano plot .
Heatmap

Volcano plot
Related Pages
Functional Enrichment Analysis(Gene Ontology Analysis and Pathway Analysis)
This process investigates which functions the genes identified as differentially expressed genes (DEGs) are primarily involved in. Regarding the representation of gene functions, Gene Ontology (GO) or pathways are often utilized.
Software commonly used for functional enrichment analysis includes clusterProfiler, topGO, and GOseq.
An example of the results from a Gene Ontology (GO) analysis is provided below.
Results of Functional Enrichment Analysis

Related Pages
RNA-Seq Data Analysis Software
This is an RNA-Seq Data Analysis Software recommended for those who:
✔︎ Seeking to avoid outsourcing or collaboration for RNA-Seq data analysis.
✔︎ Lacking time to learn RNA-Seq data analysis.
✔︎ Frustrated by the complexity of existing tools.
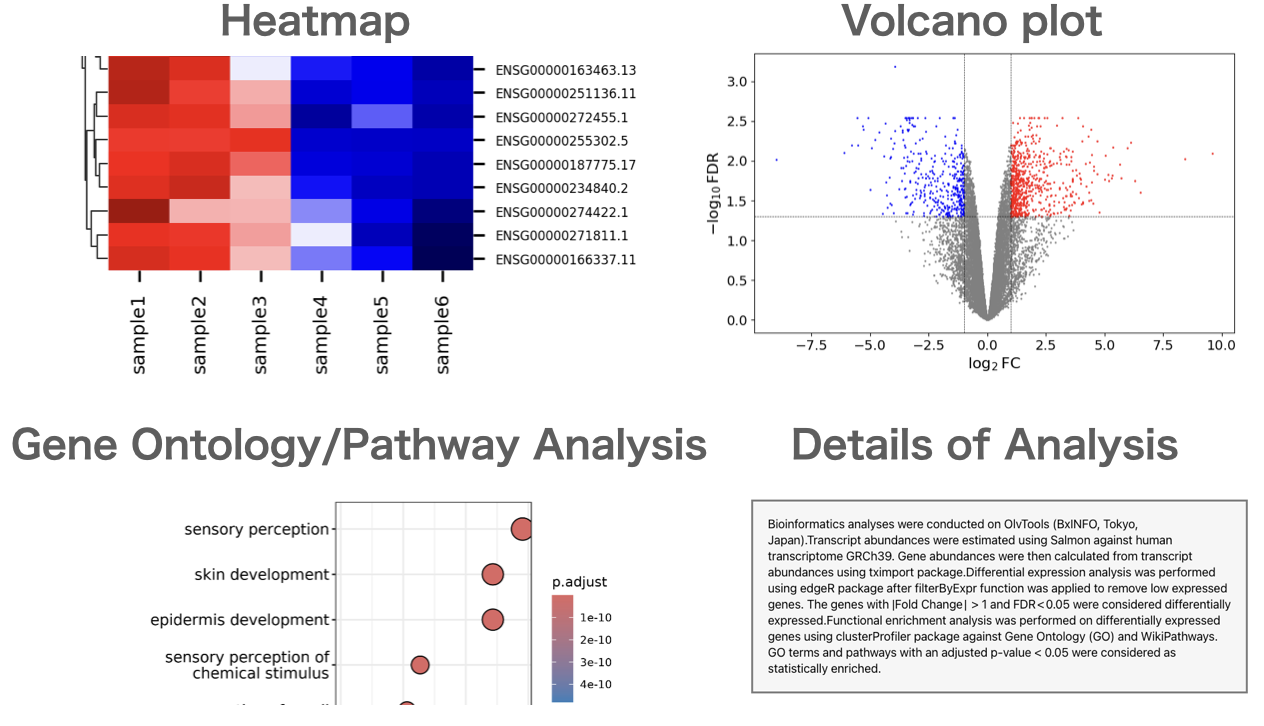
Users can perform gene expression quantification, identification of differentially expressed genes, gene ontology(GO) analysis, pathway analysis, as well as drawing volcano plots, MA plots, and heatmaps.
About the Author
BxINFO LLC
A research support company specializing in bioinformatics.
We provide tools and information to support life science research, with a focus on RNA-Seq analysis.