Pathway Analysis: What It Is and How to Conduct It
Pathway analysis, also known as pathway enrichment analysis, is an analysis method that identifies pathways significantly overrepresented in a given gene list compared to the entire set of genes.
It is commonly utilized to identify the pathways that differentially expressed genes from RNA-Seq analysis results are strongly involved in.
What is Pathway?
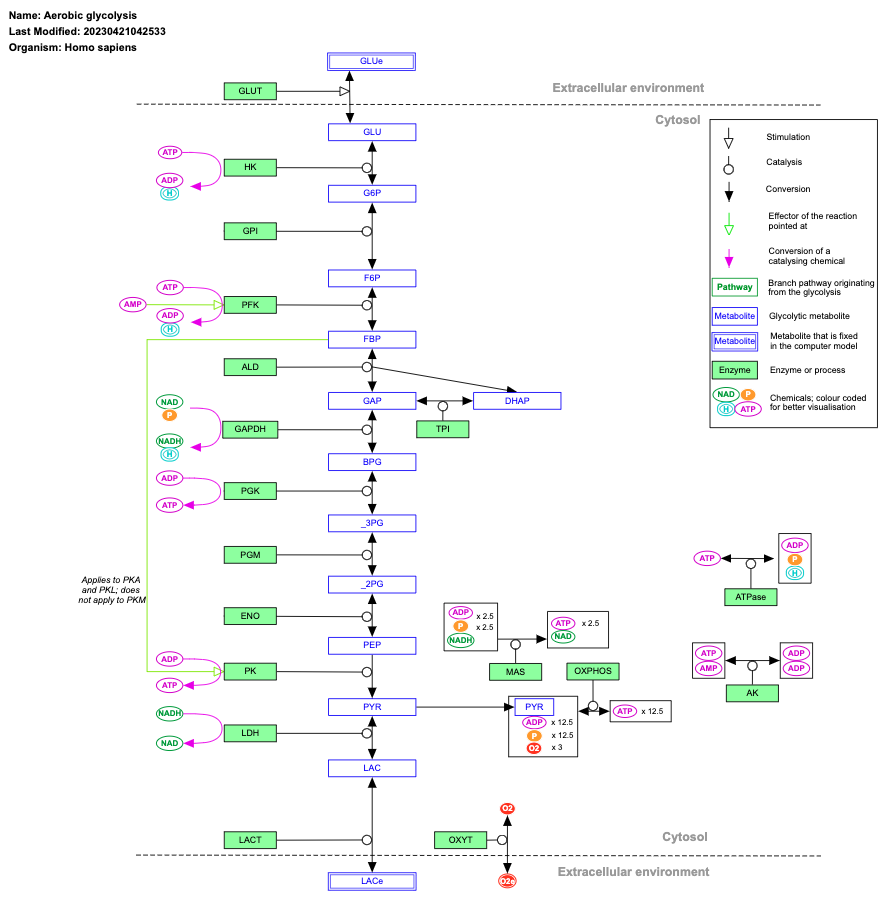
A pathway represents the interactions among genes, proteins, and compounds. It includes information on metabolic pathways, signaling cascades, protein-protein interactions, and gene regulatory networks.
Well-known databases for pathway include Kyoto Encyclopedia of Genes and Genomes(KEGG) and WikiPathways. KEGG is freely available to academic researchers, but corporate users are required to obtain a license. On the other hand, WikiPathways is created by the community and is freely accessible to anyone.
Example of a Pathway(WikiPathways)

What is Pathway Analysis?
Pathway analysis identifies pathways that are significantly overrepresented in a specific gene set compared to the background gene set.
Suppose that an RNA-Seq analysis reveals 600 differentially expressed genes, of which 30 out of 600 are associated with the pathway "Cytoplasmic ribosomal proteins", and in a background gene set of 5598 genes, 87 out of 5598 are associated with "Cytoplasmic ribosomal proteins". In this case, the pathway "Cytoplasmic ribosomal proteins" would be considered significantly overrepresented compared to its expected frequency of a random sampling of 600 genes from the background set.
RNA-Seq Data Analysis Software
This is an RNA-Seq Data Analysis Software recommended for those who:
✔︎ Seeking to avoid outsourcing or collaboration for RNA-Seq data analysis.
✔︎ Lacking time to learn RNA-Seq data analysis.
✔︎ Frustrated by the complexity of existing tools.

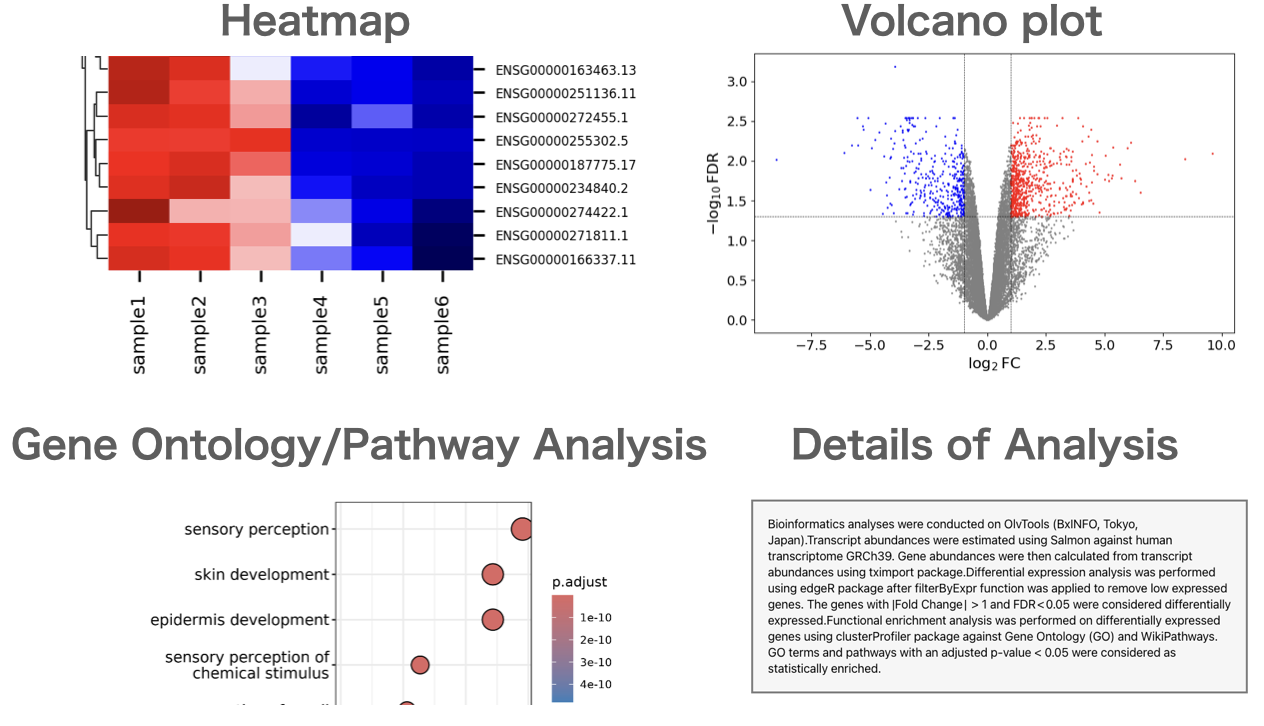
Users can perform gene expression quantification, identification of differentially expressed genes, gene ontology(GO) analysis, pathway analysis, as well as drawing volcano plots, MA plots, and heatmaps.
About the Author
BxINFO LLC
A research support company specializing in bioinformatics.
We provide tools and information to support life science research, with a focus on RNA-Seq analysis.