RNA-Seq Data Analysis Software
Target Users
✔︎ Seeking to avoid outsourcing or collaboration for RNA-Seq data analysis.
✔︎ Lacking time to learn RNA-Seq data analysis.
✔︎ Frustrated by the complexity of existing tools.
Easily Conduct RNA-Seq Data Analysis even for a Beginner
This web-based software enables even beginners to easily conduct RNA-Seq data analysis without the need for a high-performance computer or programming skills.
Overview
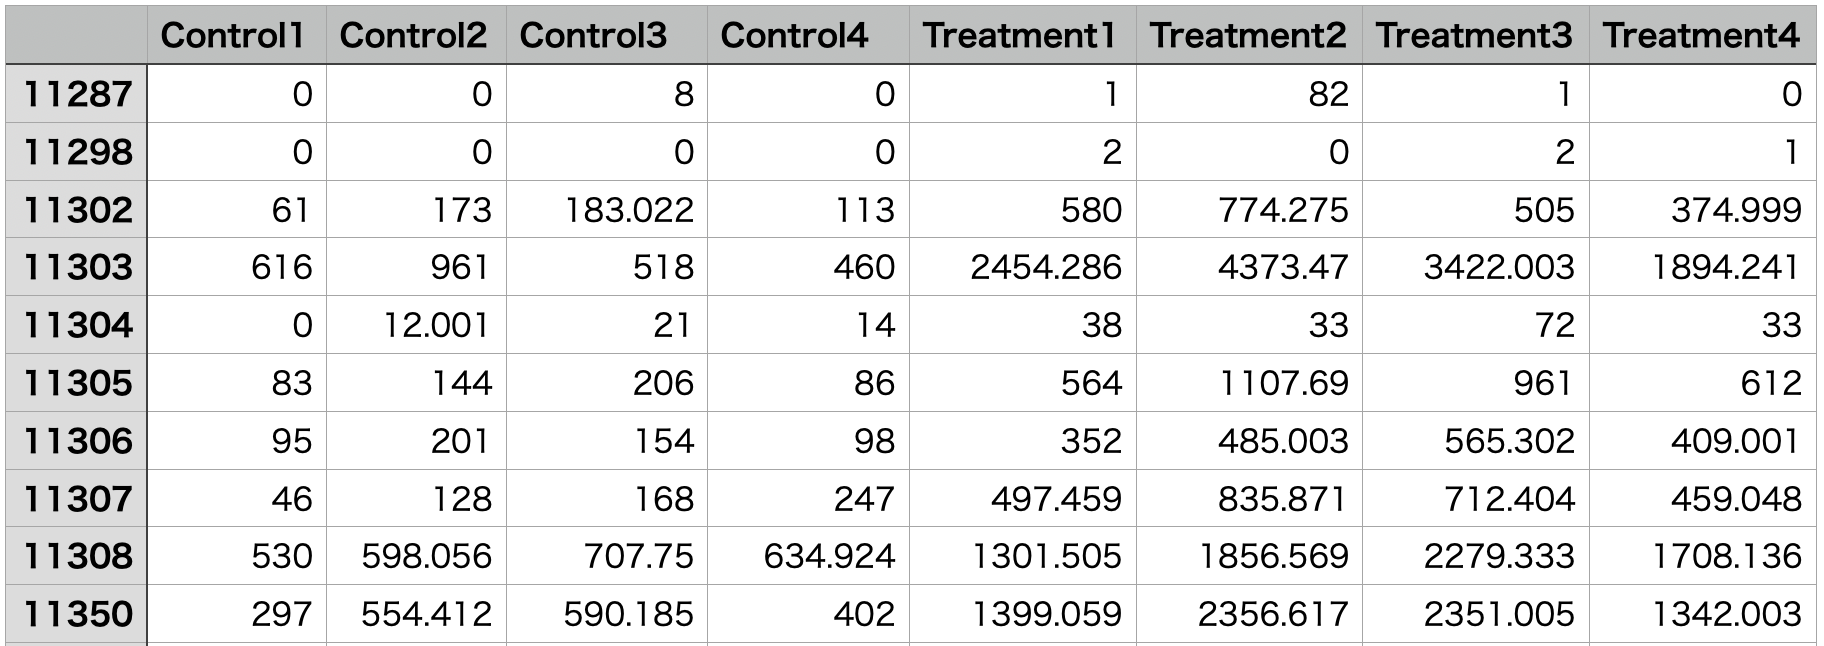
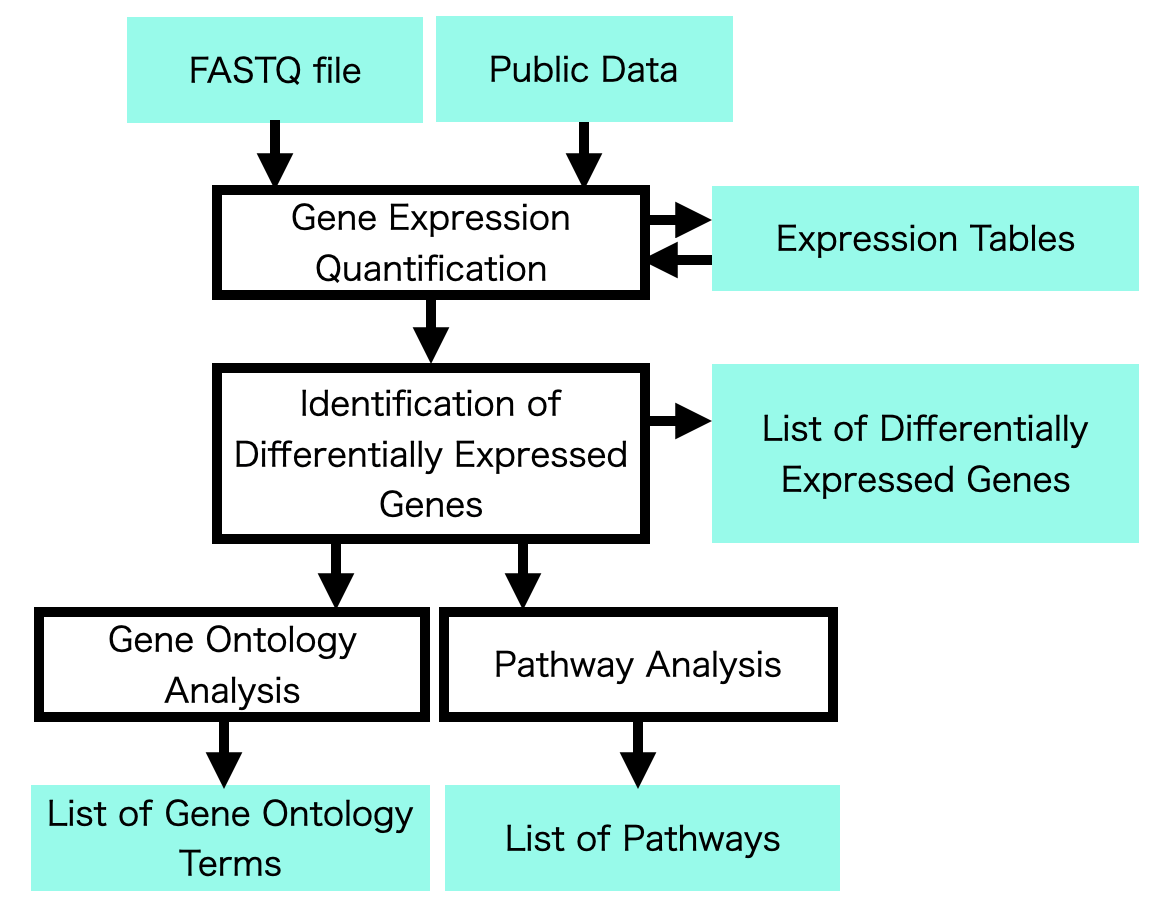
Starting with either raw RNA-Seq data (FASTQ files/public data) or expression tables (CSV/TSV files), users can perform gene expression quantification, identification of differentially expressed genes, gene ontology(GO) analysis, pathway analysis, as well as drawing volcano plots, MA plots, and heatmaps.
Functions
Quantification of Gene Expression
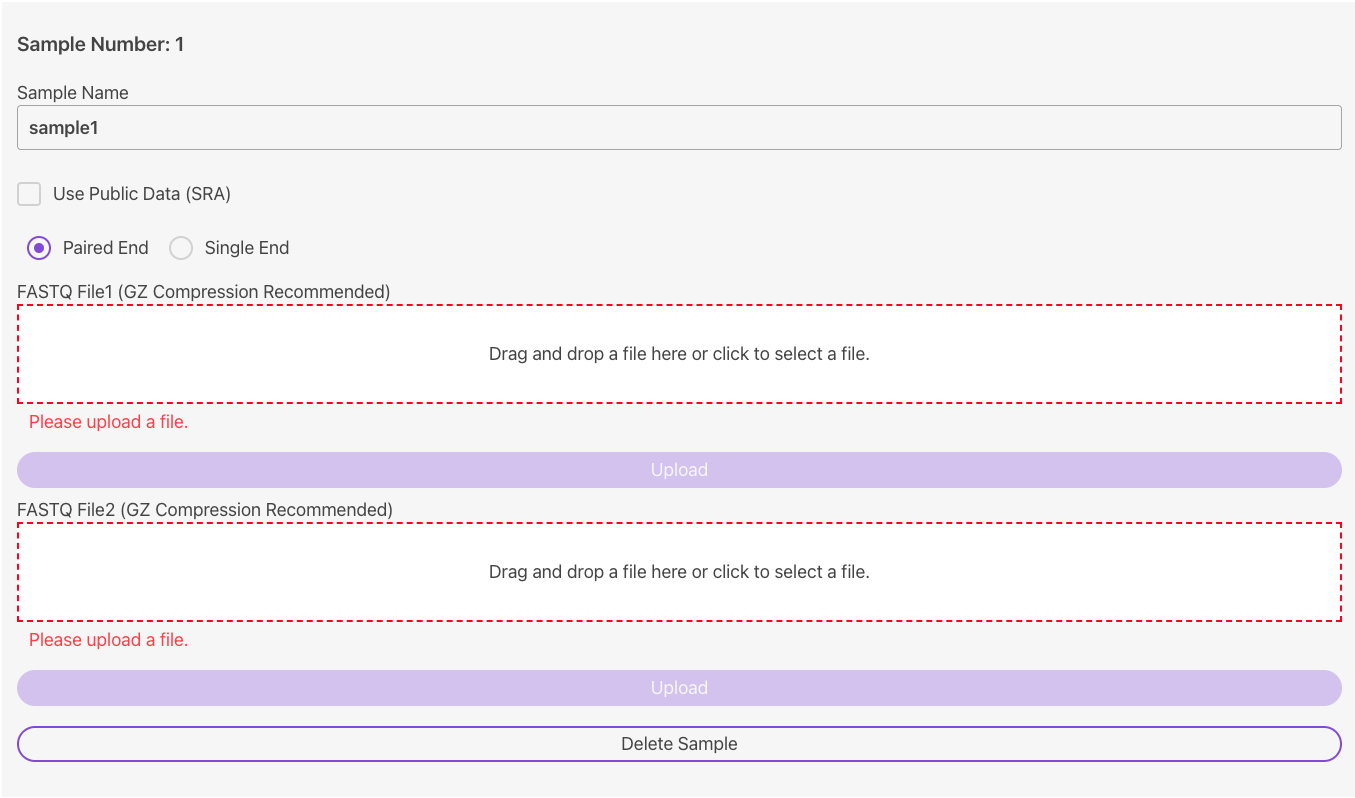
This feature quantifies gene expression levels from raw data (FASTQ files/public data).
Identification of Differentially Expressed Genes
This feature lists differentially expressed genes between different conditions.

Heatmap
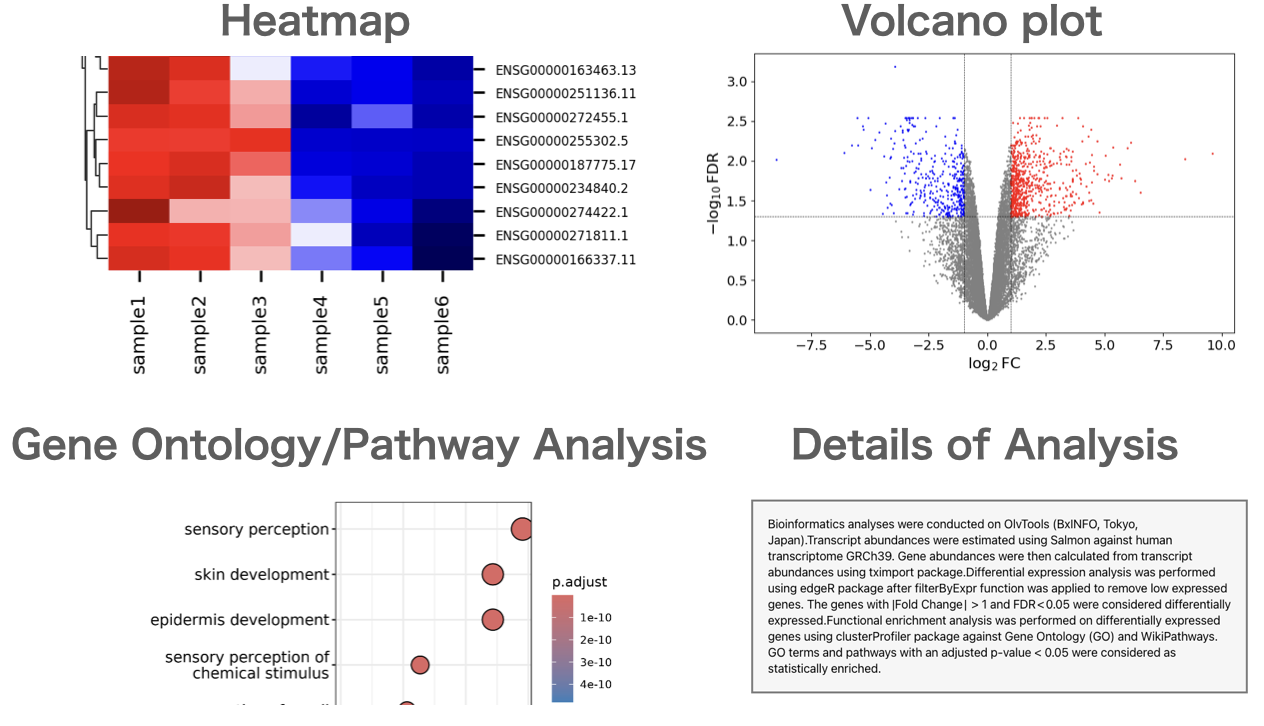
Visualization of gene expression levels. Clustering is also performed simultaneously to place similar genes near each other.

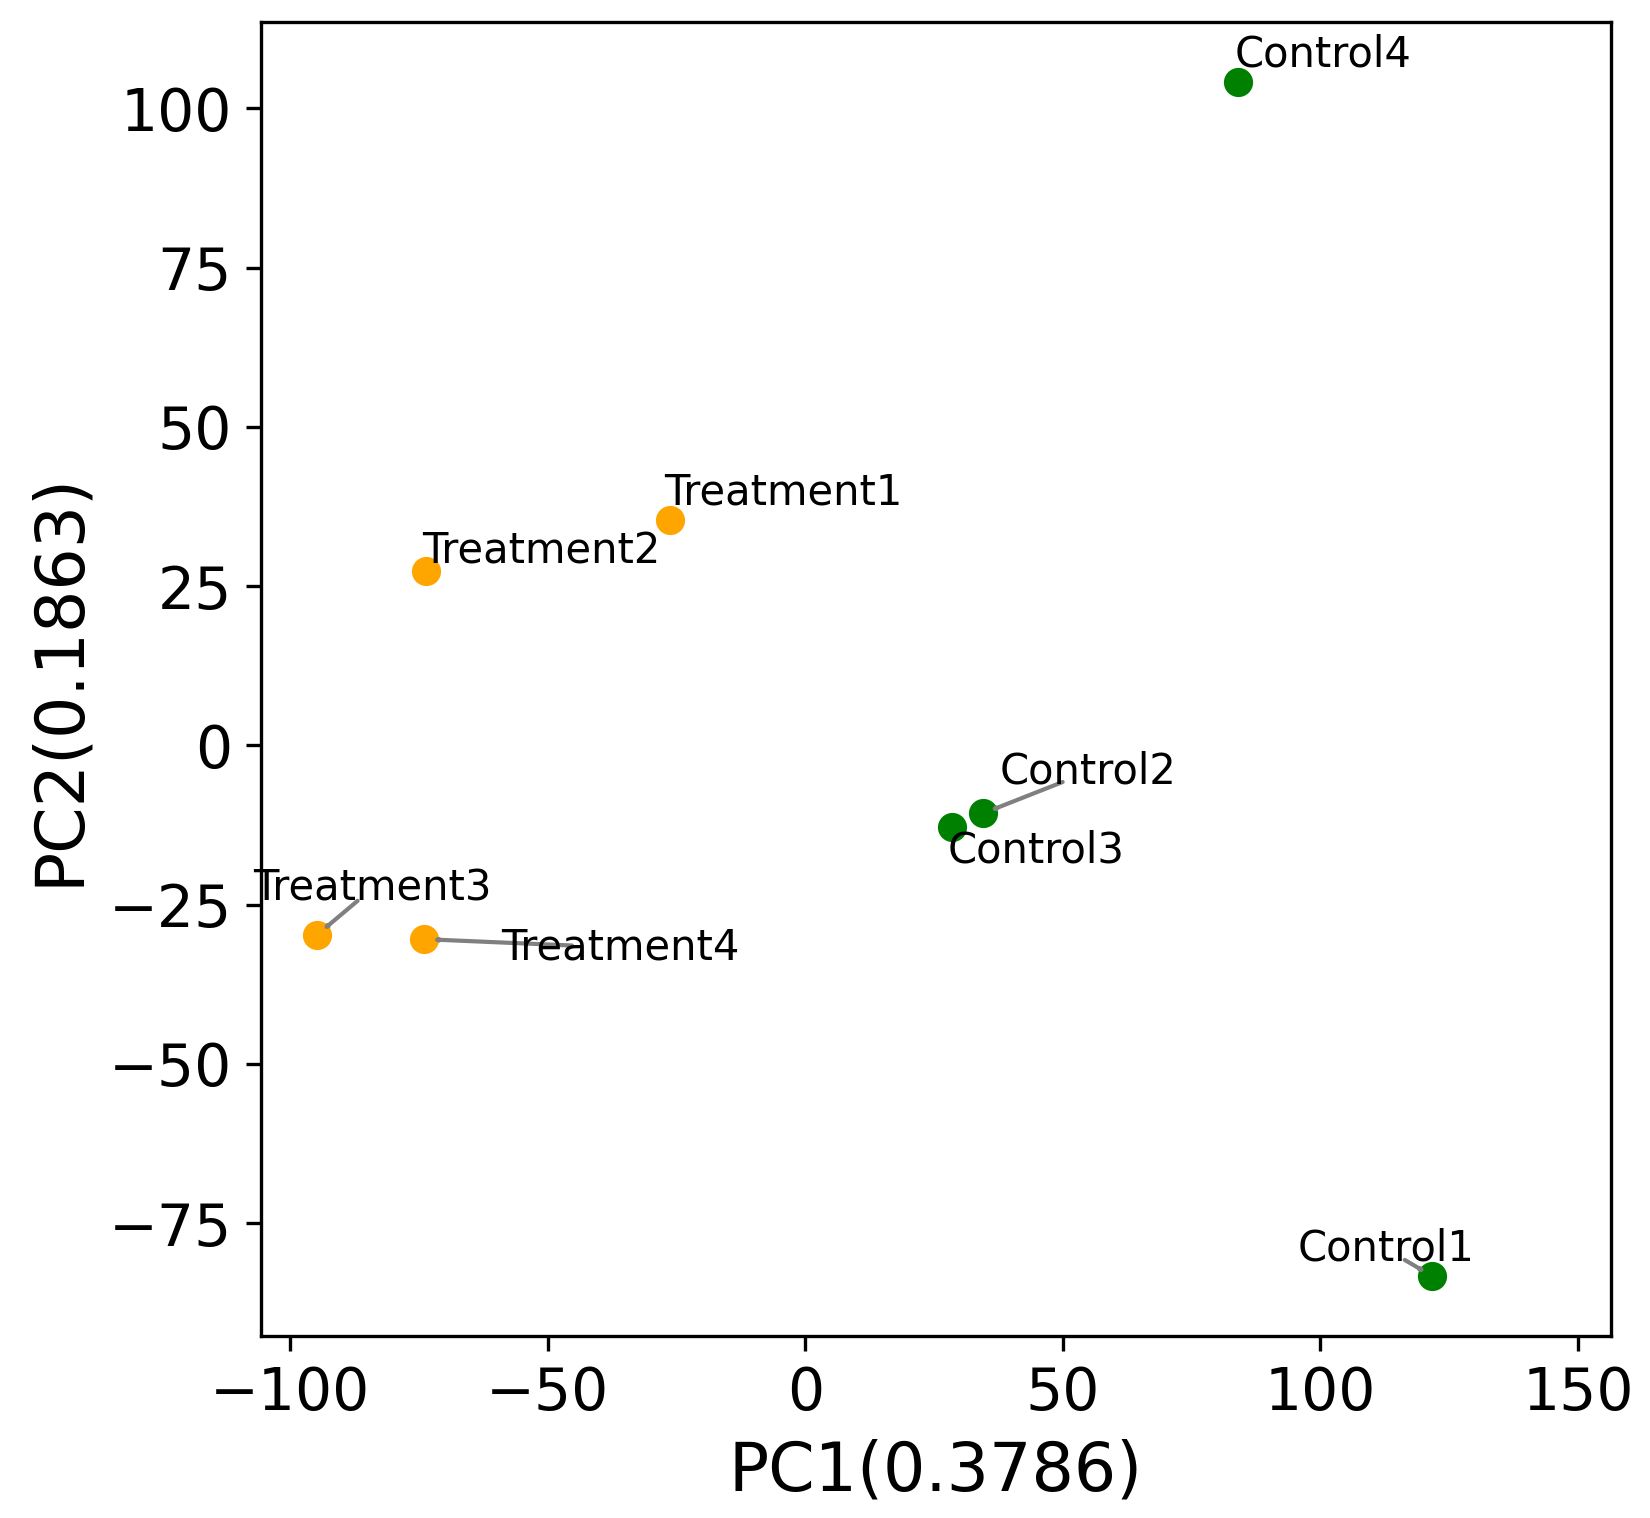
Principal Component Analysis (PCA)
Visualization of similarity between samples using principal component analysis.
Hierarchical Clustering
Visualization of similarity between samples using hierarchical clustering.

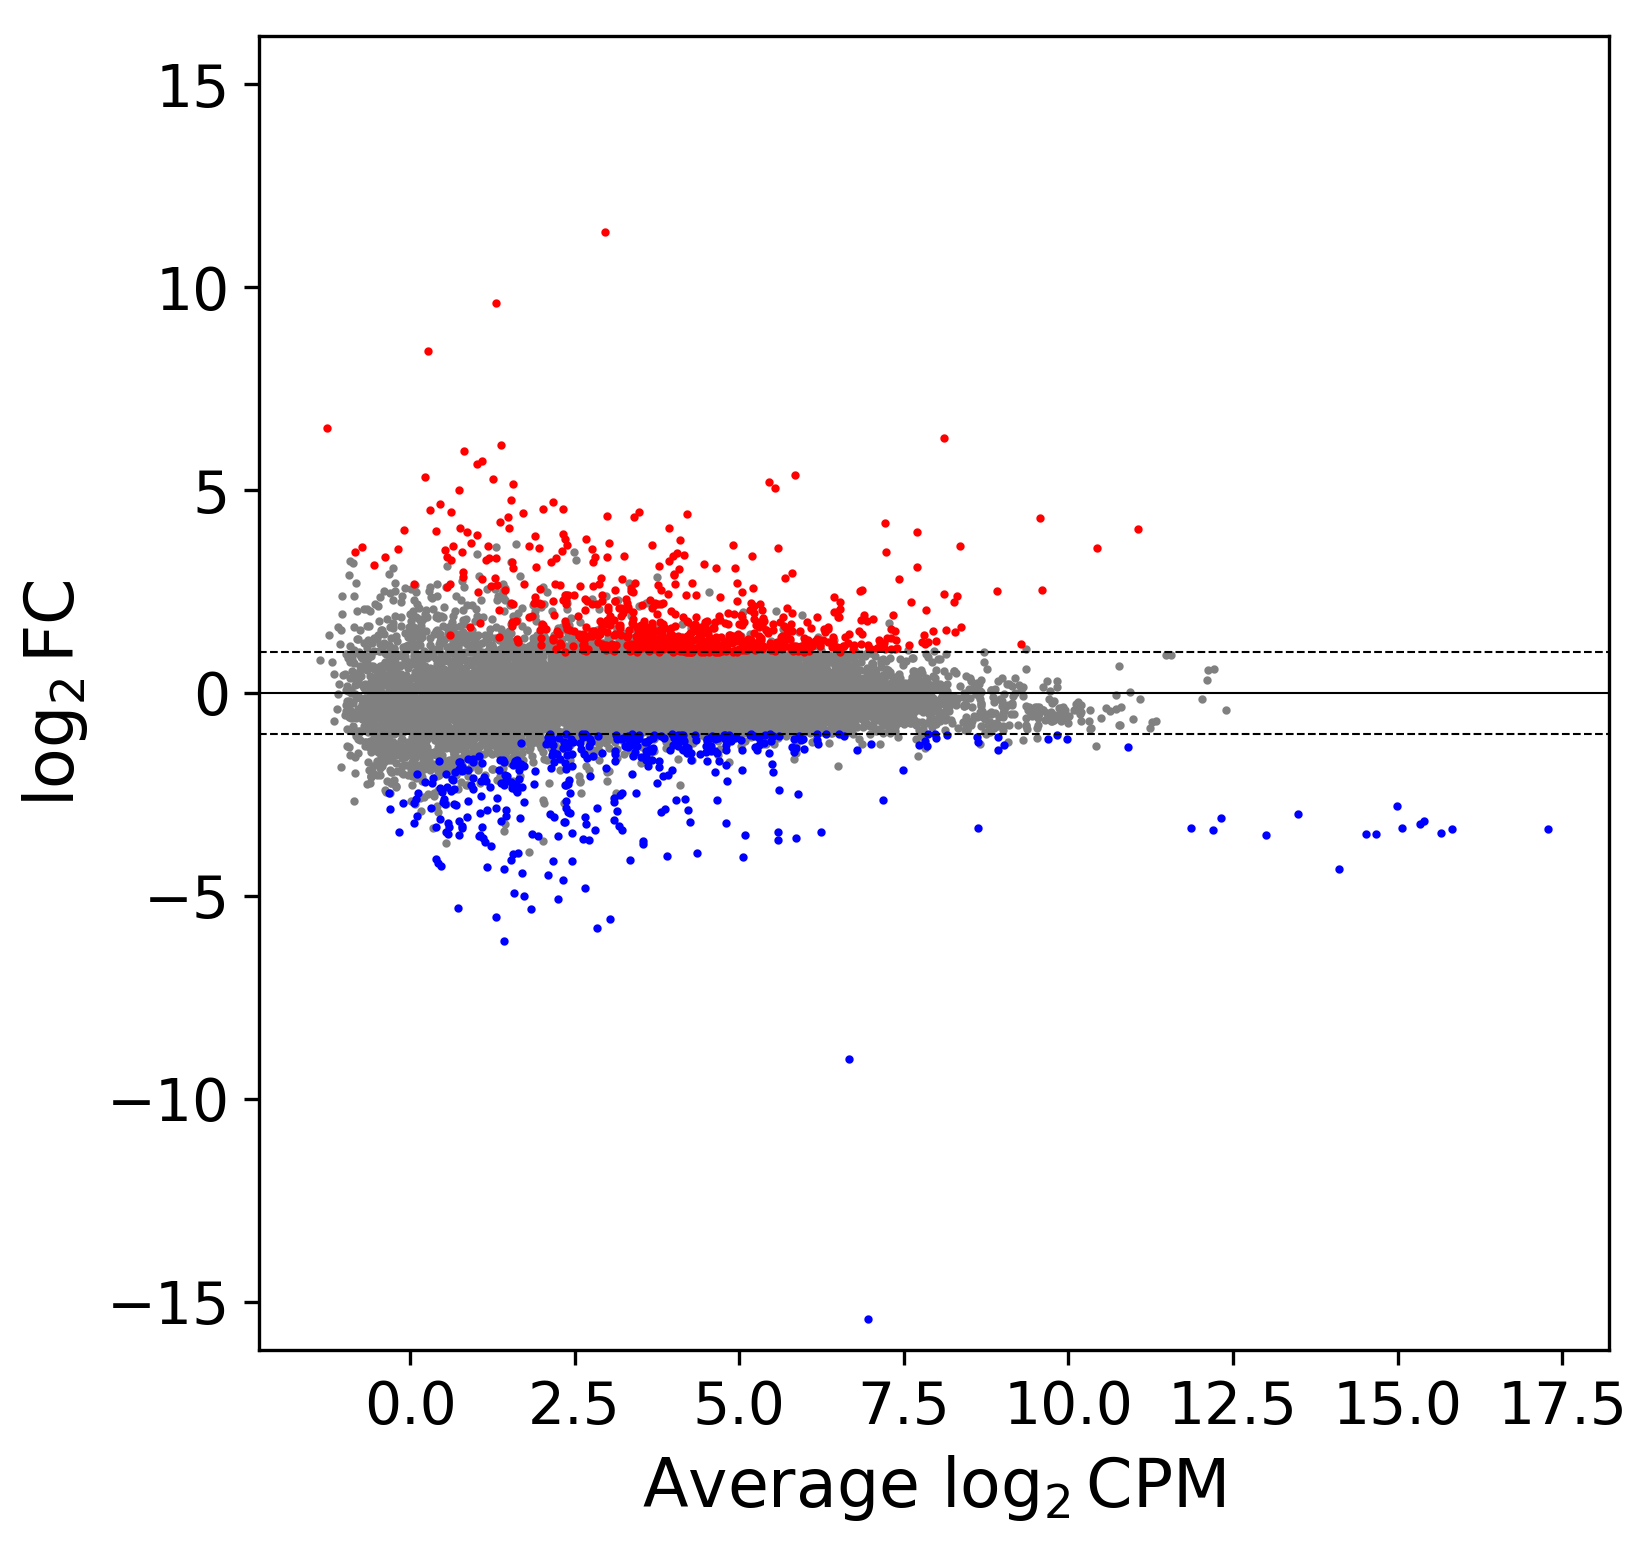
MA plot
Plot of mean expression levels on the x-axis and expression changes on the y-axis.
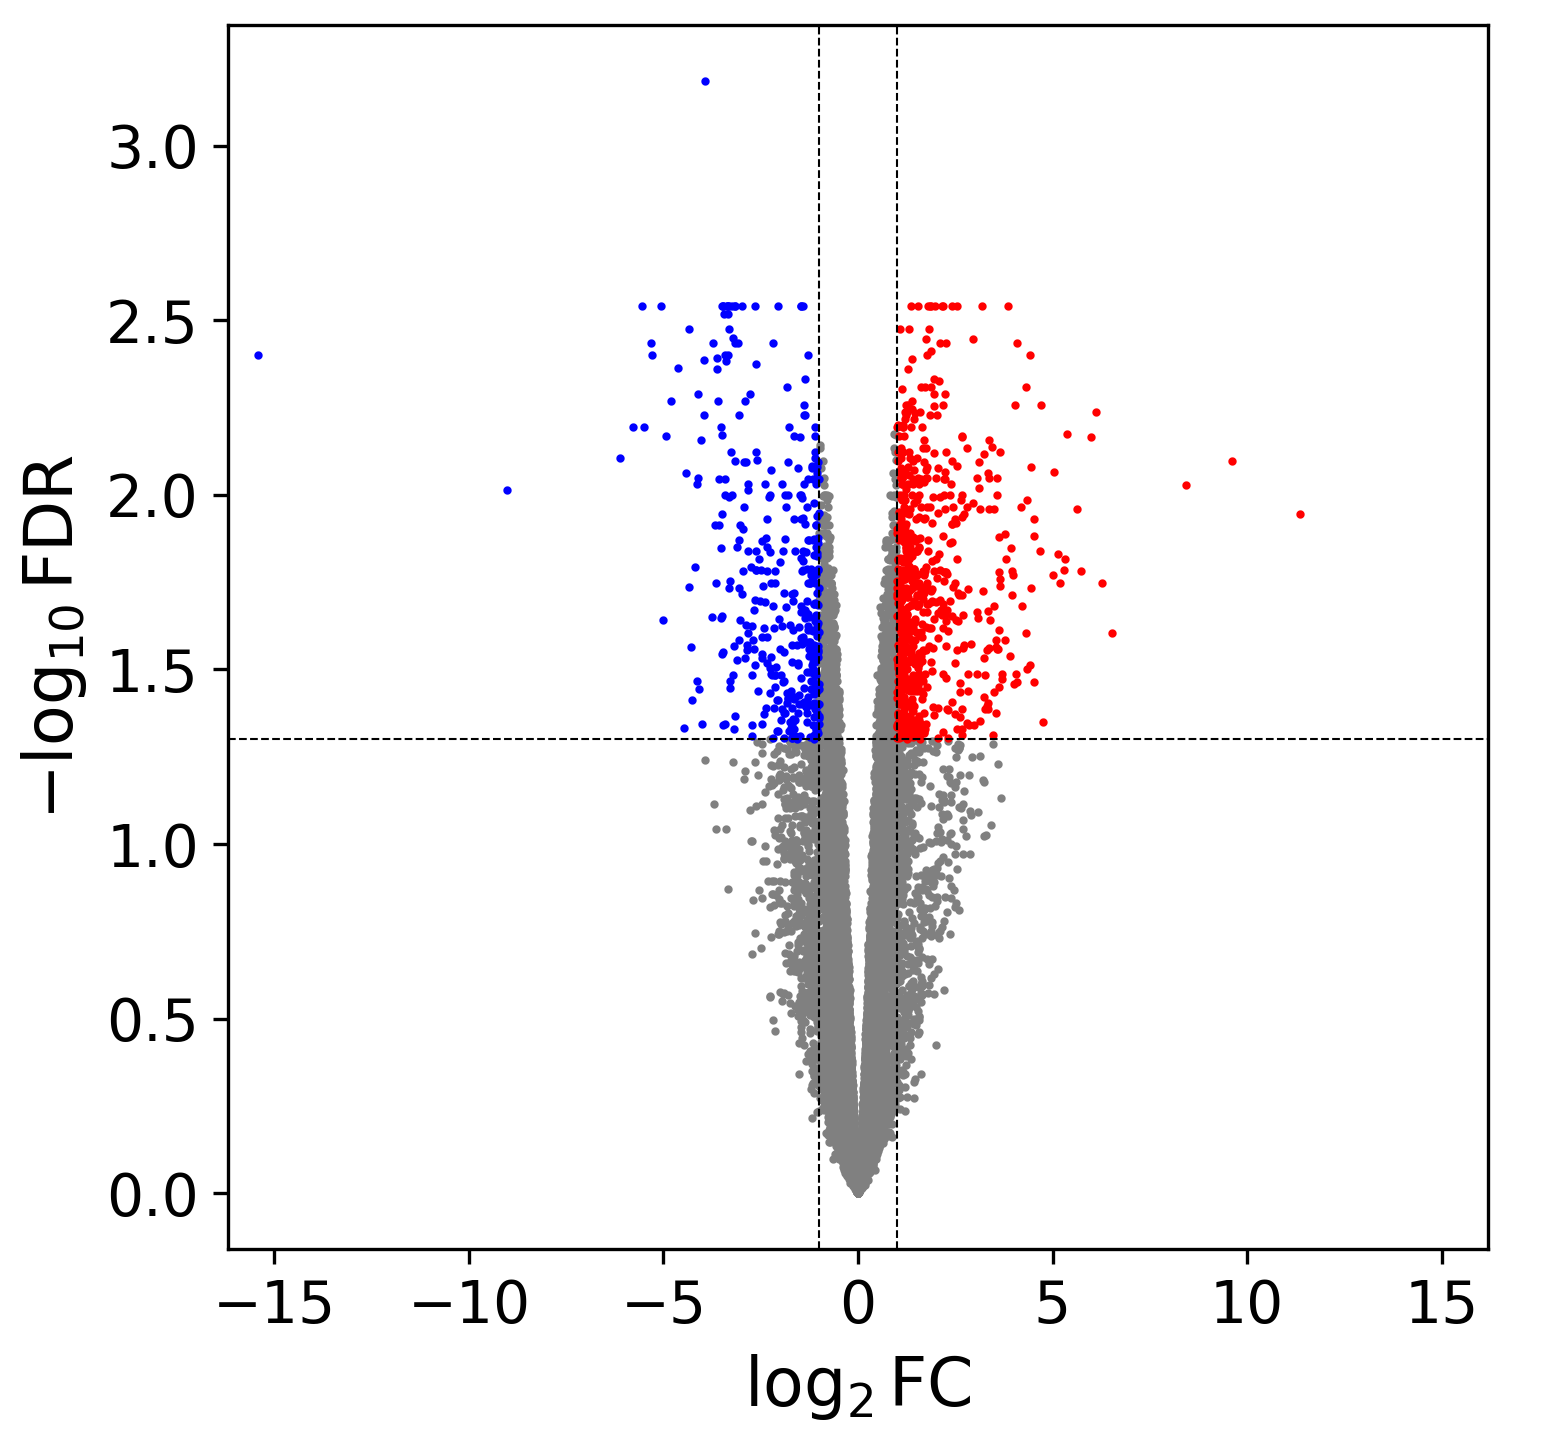
Volcano plot
Plot of expression changes on the x-axis and statistical significance on the y-axis.
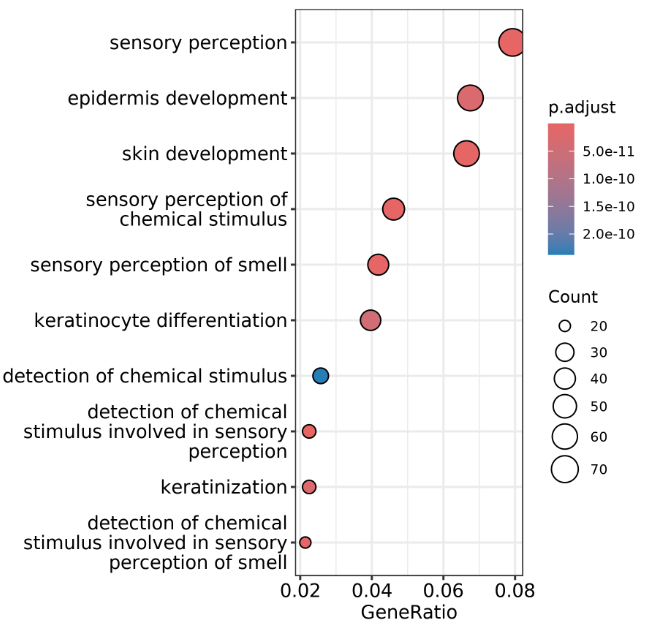
Gene Ontology(GO) Analysis / Pathway Analysis
This feature detects Gene Ontology terms and pathways enriched in differentially expressed genes.
Details of Analysis
Explanation of the Analysis Conducted.

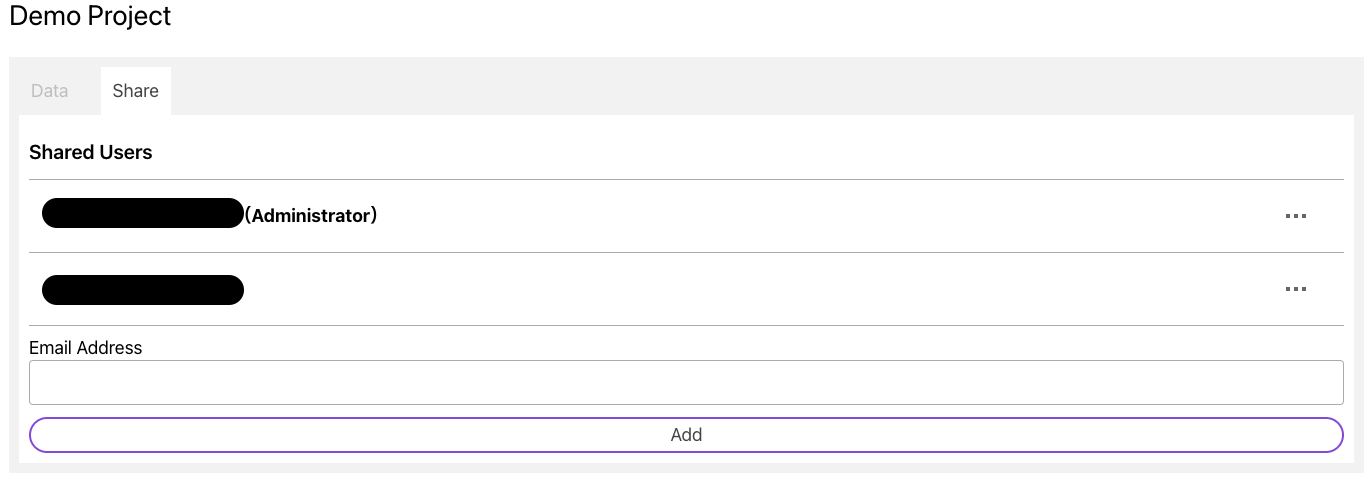
Data Sharing
Users can share data just by entering an email address.
Pricing
All features are available for 24 USD per month.
| Our software | Other company's software | Contracted service | |
| Pricing | 7-day free trial Monthly Plan: 24 USD/month Annual Plan: 120 USD/year | About several thousand USD/year | About several hundred USD/analysis |
|---|---|---|---|
| PC Setup | No Need | Required | No Need |
| Parameters | Freely configurable | Freely configurable | specified by provider |
| Delivery | Available immediately | Inquiry to sales required | Several days to weeks |
Research Publications Using OlvTools
Since its launch in 2023, OlvTools has been widely used by researchers across research institutes, universities, hospitals, and private companies. It has gained over 2,000 registered users so far and continues to support their daily research activities.
Analysis results produced with OlvTools have also been used in research publications. You can find papers that actually used OlvTools here.
Frequently Asked Questions
Is there support for how to use the service and for understanding the analysis methods?
If you have any issues, please feel free to contact us.
What file formats can be uploaded?
You can upload FASTQ files (uncompressed/gzip compressed) as raw data, and CSV/TSV files as expression tables.
What Species Are Supported?
Quantification of gene expression, identification of differentially expressed genes, heatmaps, principal component analysis (PCA), hierarchical clustering, and MA plots are supported for all species. Gene Ontology (GO) analysis and pathway analysis are available only for human, mouse, and rat.
Can I get a receipt?
We will send the receipt via email.
What is an expression table?
It is a table outputting the number of reads mapped to each gene. When you use our service for gene expression quantification, you will obtain both the raw count and the normalized TPM values.
