How to Run FastQC from the Command Line
Introduction
When sequencing is performed using a next-generation sequencer (NGS), raw data in the form of FASTQ files, which contain the base sequences of the reads and their quality scores, is obtained. After conducting NGS, the first step is to perform a quality check on the FASTQ files to ensure there are no issues with the quality of the reads. The most well-known software for checking the quality of FASTQ files is FastQC.
In this page, we will explain the steps to perform quality checks using FastQC from the command line.
Installation
FastQC can be installed from here.

For Mac users who prefer to work with the command line interface (CUI), selecting the Win/Linux zip file is recommended.
It's also possible to download it via command line as shown below (adjust the version as needed).
Let's check if it works properly by displaying the help message.
If the following message is displayed, the setup was successful. It is recommended to add FastQC to your system's PATH.
Performing Quality Check
If an HTML file and a ZIP file are created in the results folder, the process was successful.
FastQC Report
The HTML file contains the following content.
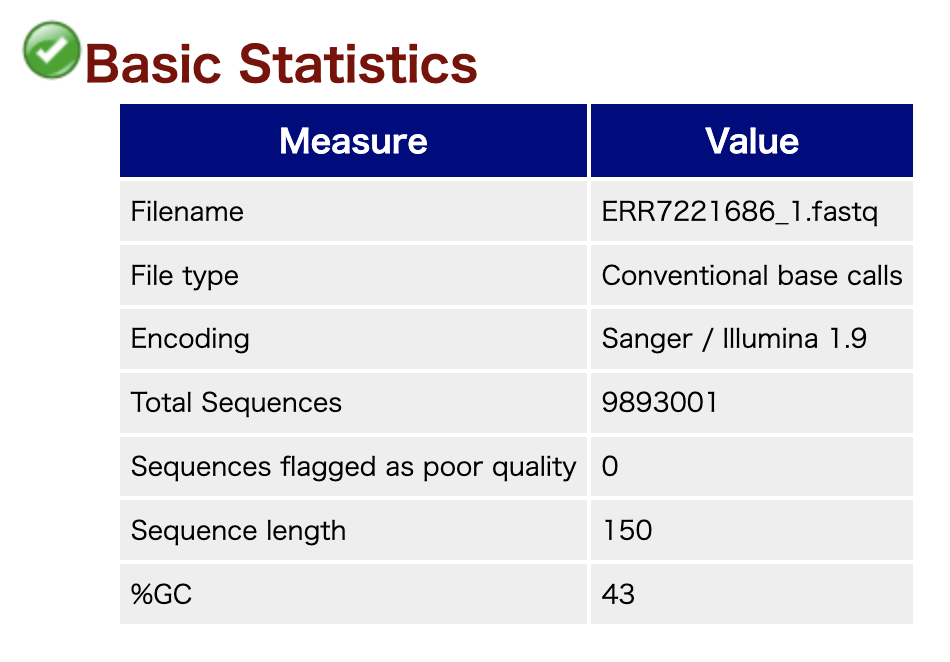
Basic Statistics
Displays basic information.
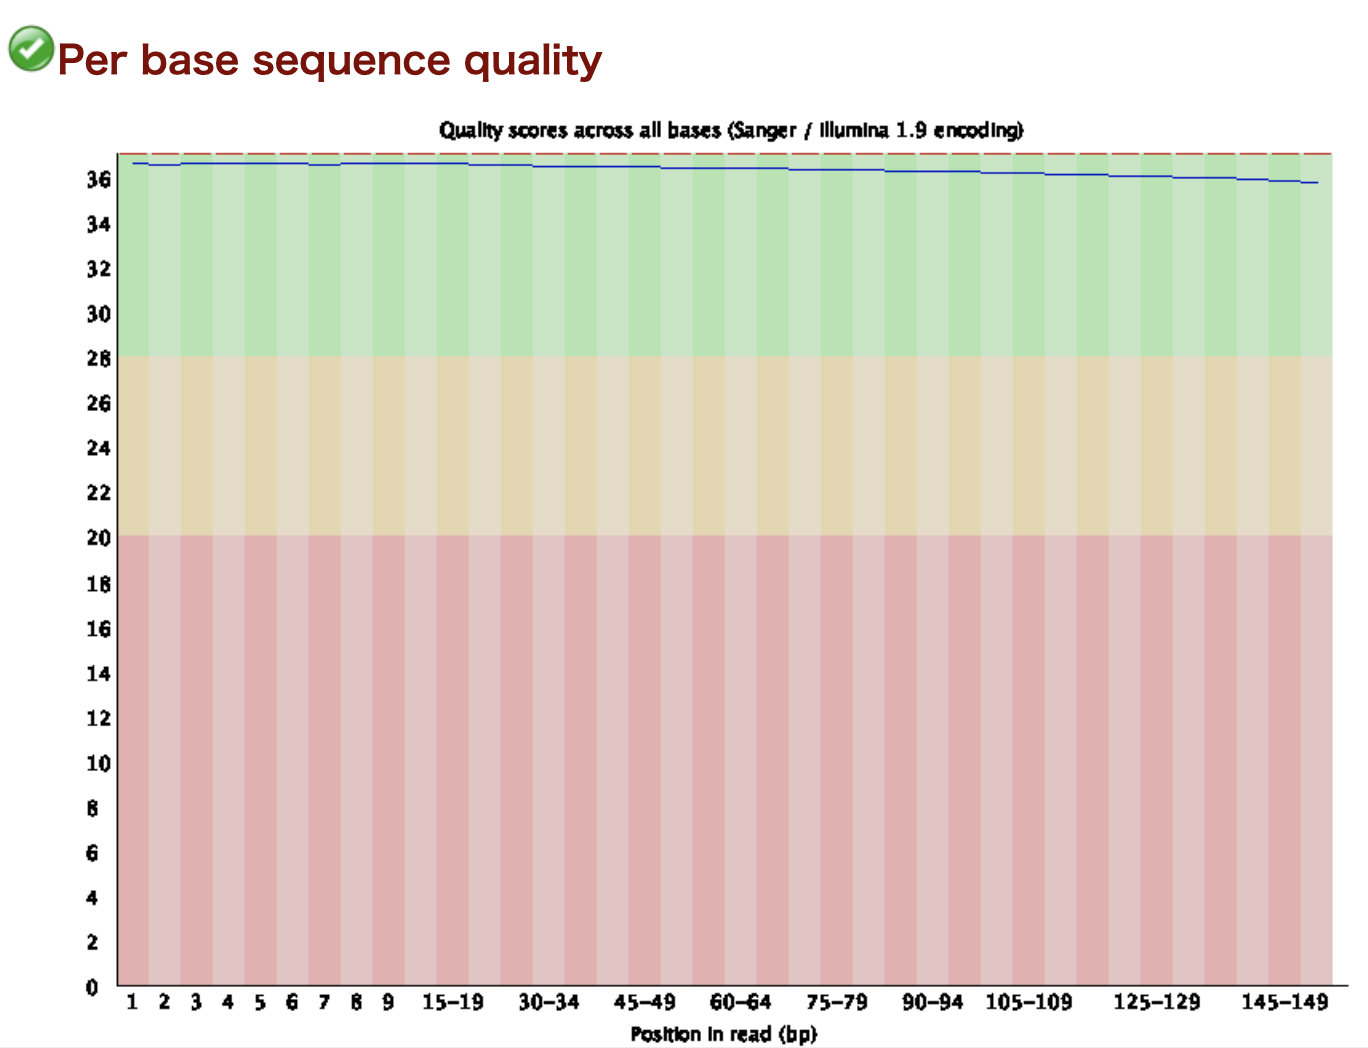
Per base sequence quality
Shows the quality at each position in the reads. The horizontal axis represents the position in the read, and the vertical axis represents the quality.
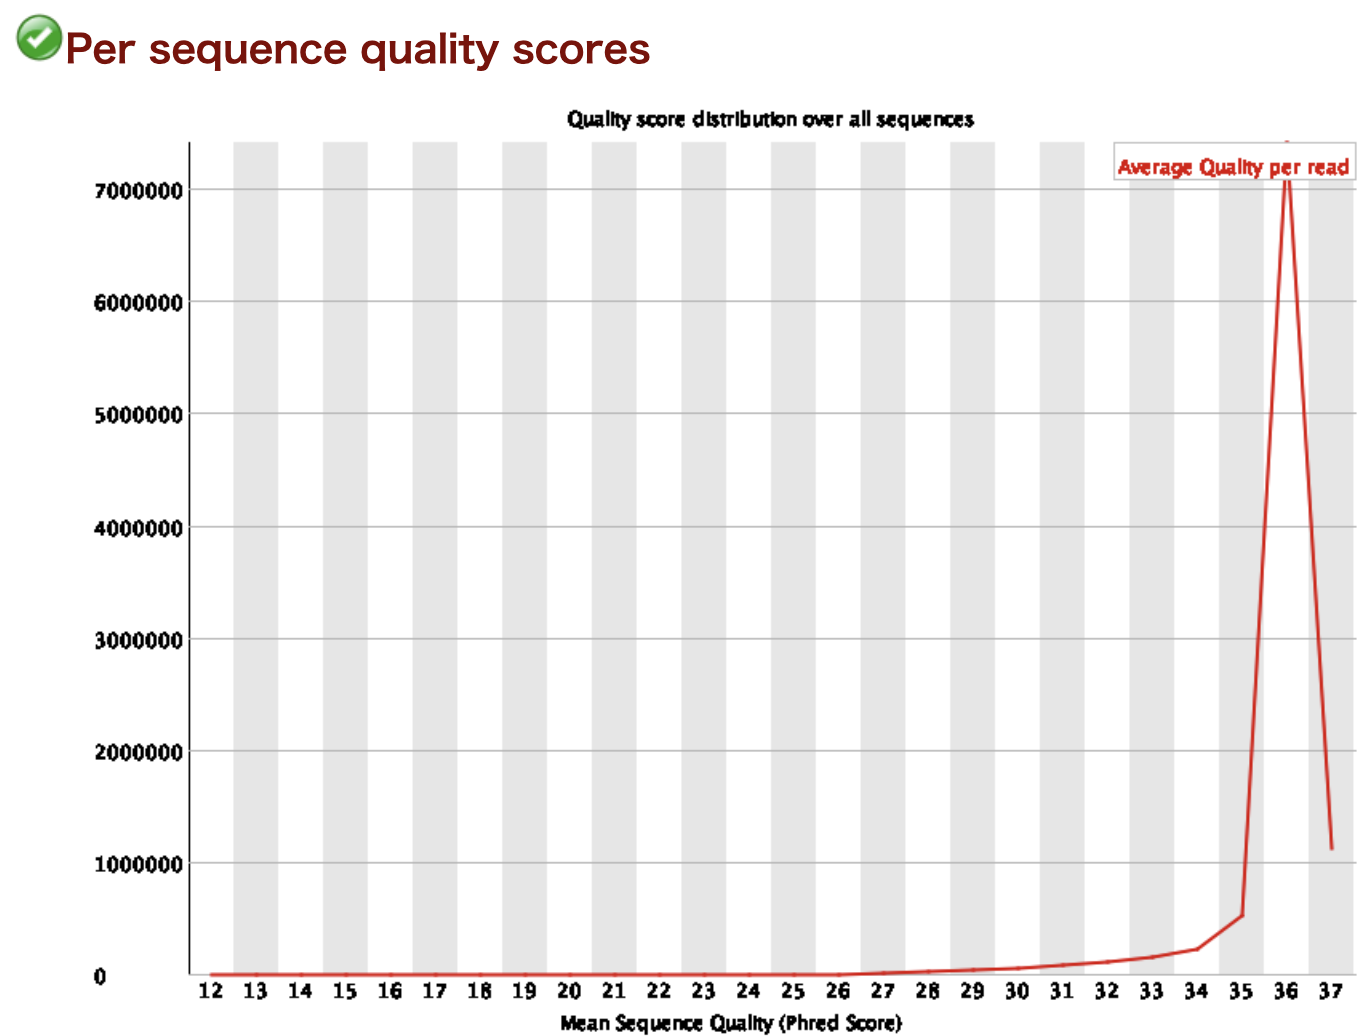
Per sequence quality scores
Displays the distribution of average quality scores. The horizontal axis represents the average quality score, and the vertical axis represents the number of reads.
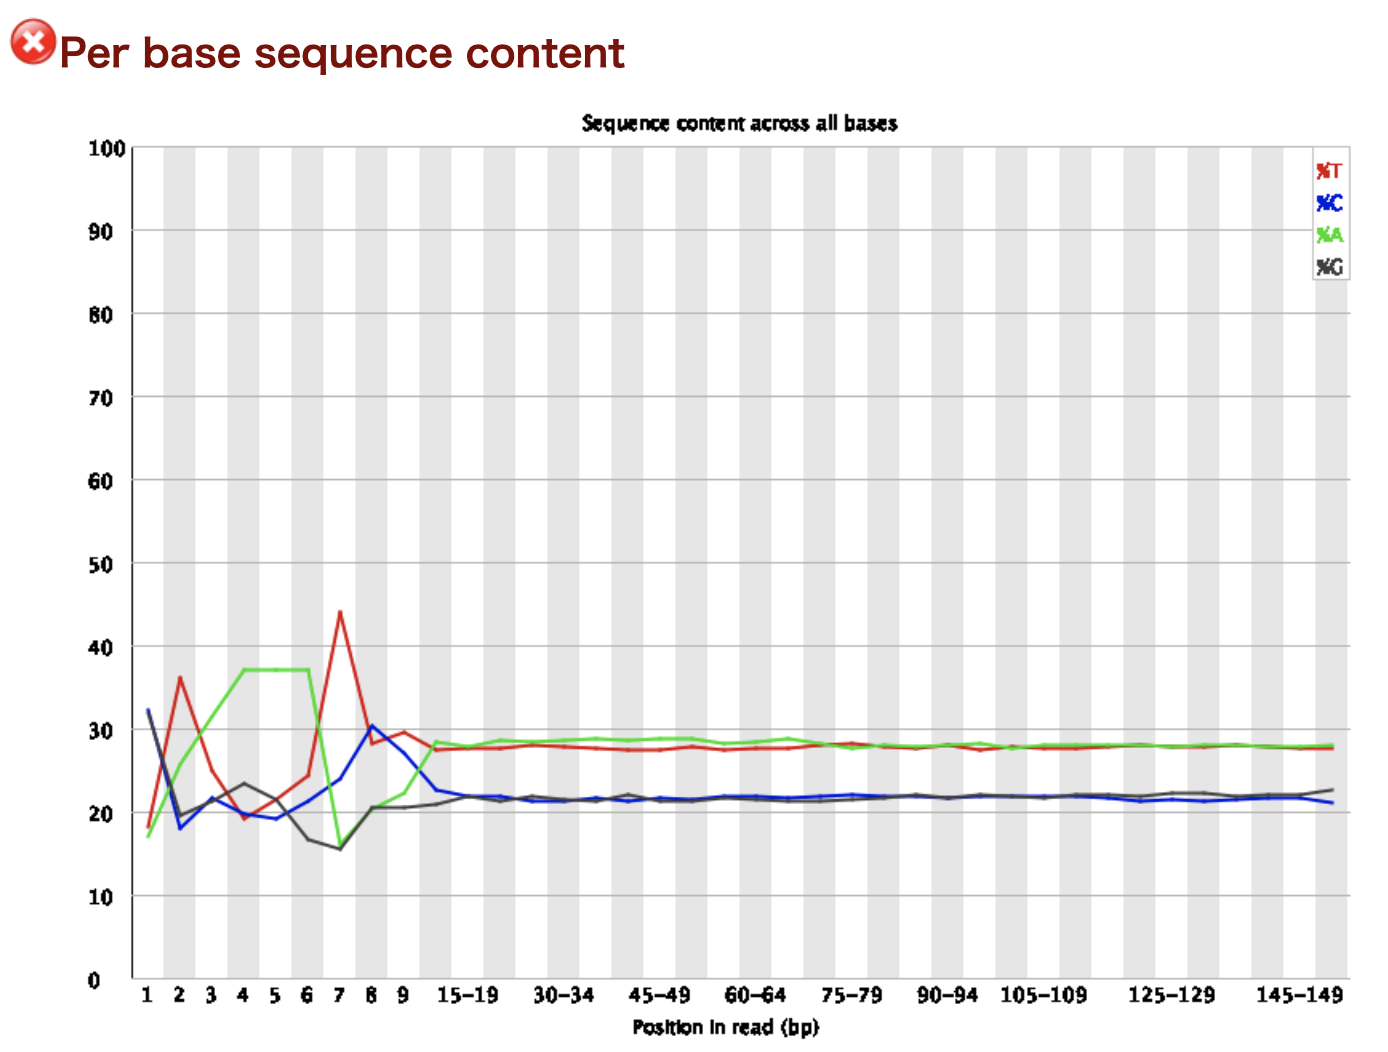
Per base sequence content
Shows the base composition at each position in the reads. The horizontal axis represents the position in the read, and the vertical axis represents the proportion of each base.
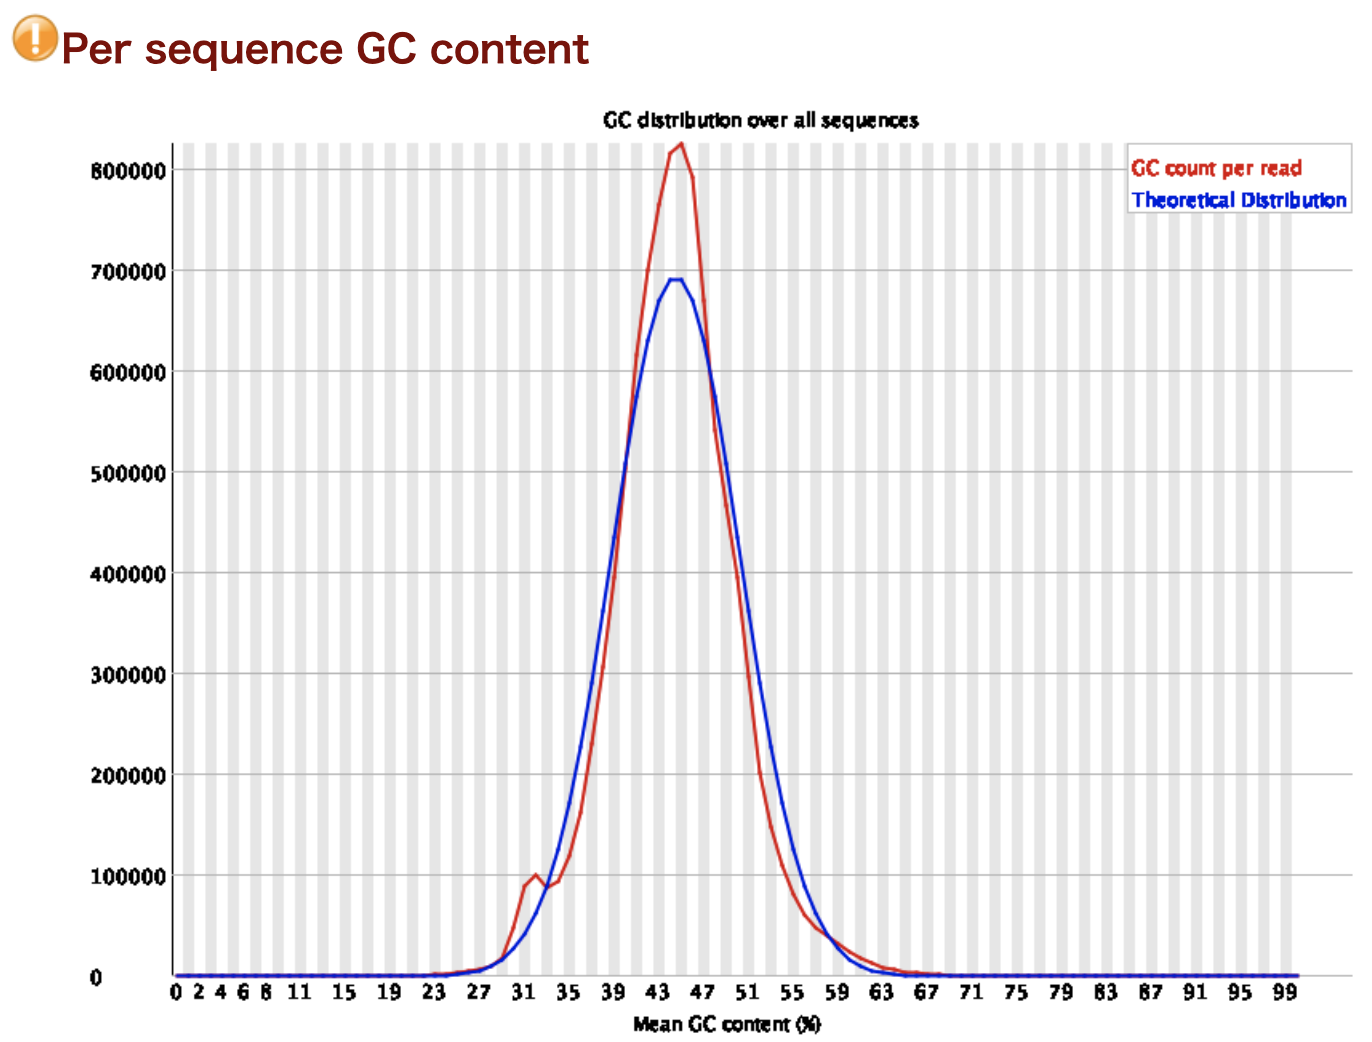
Per sequence GC content
Displays the distribution of GC content for each read. The horizontal axis represents the GC content, and the vertical axis represents the number of reads.
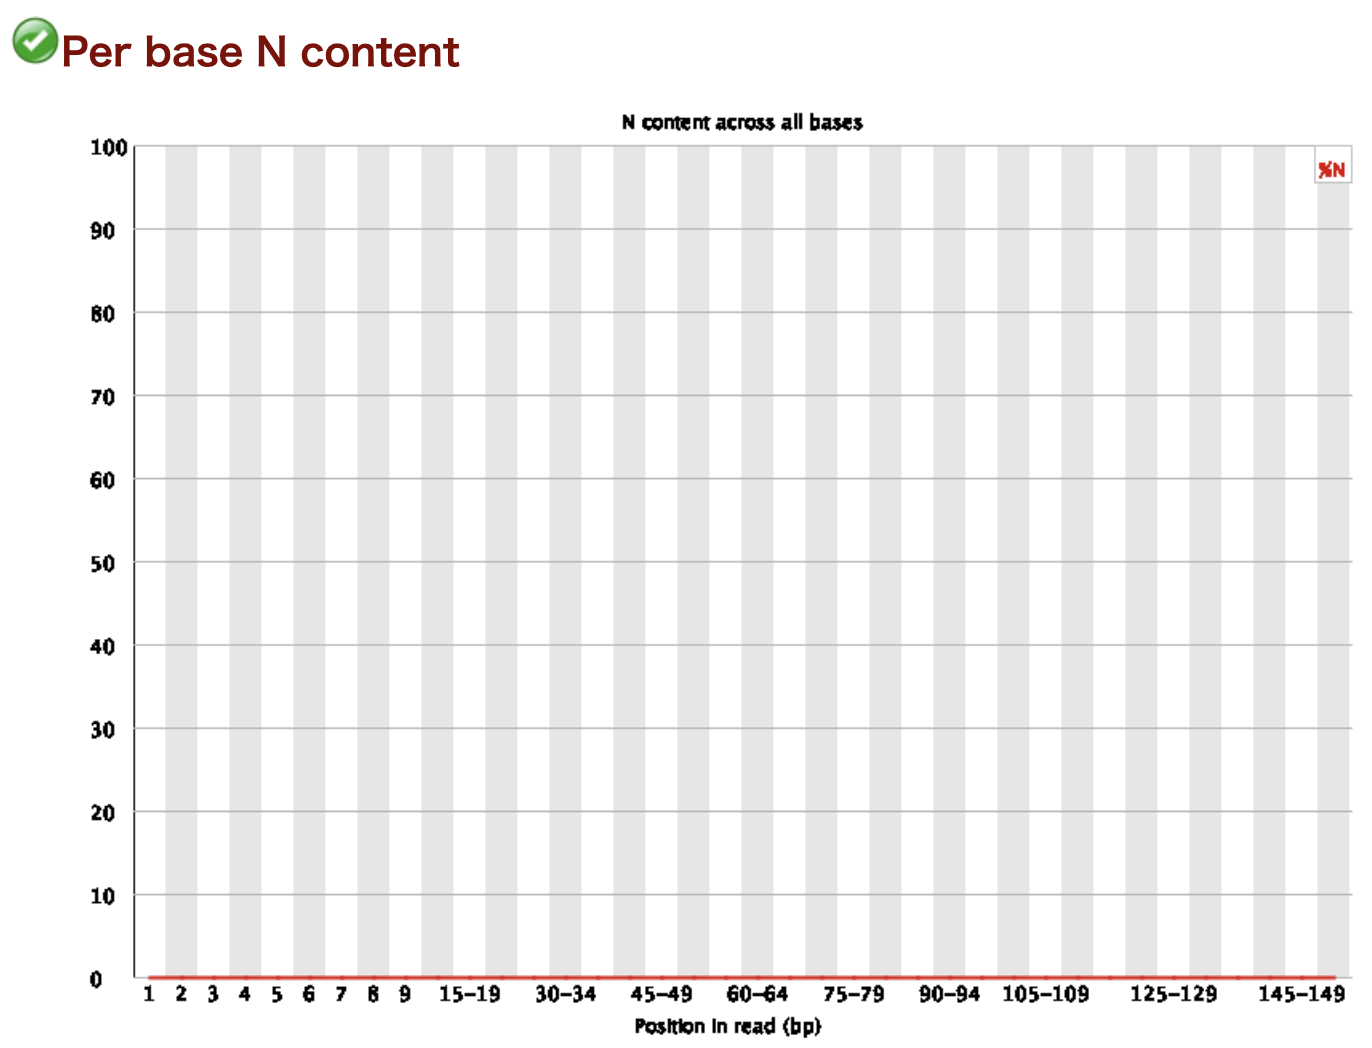
Per base N content
Shows the proportion of N bases at each position in the reads. The horizontal axis represents the position in the read, and the vertical axis represents the proportion.
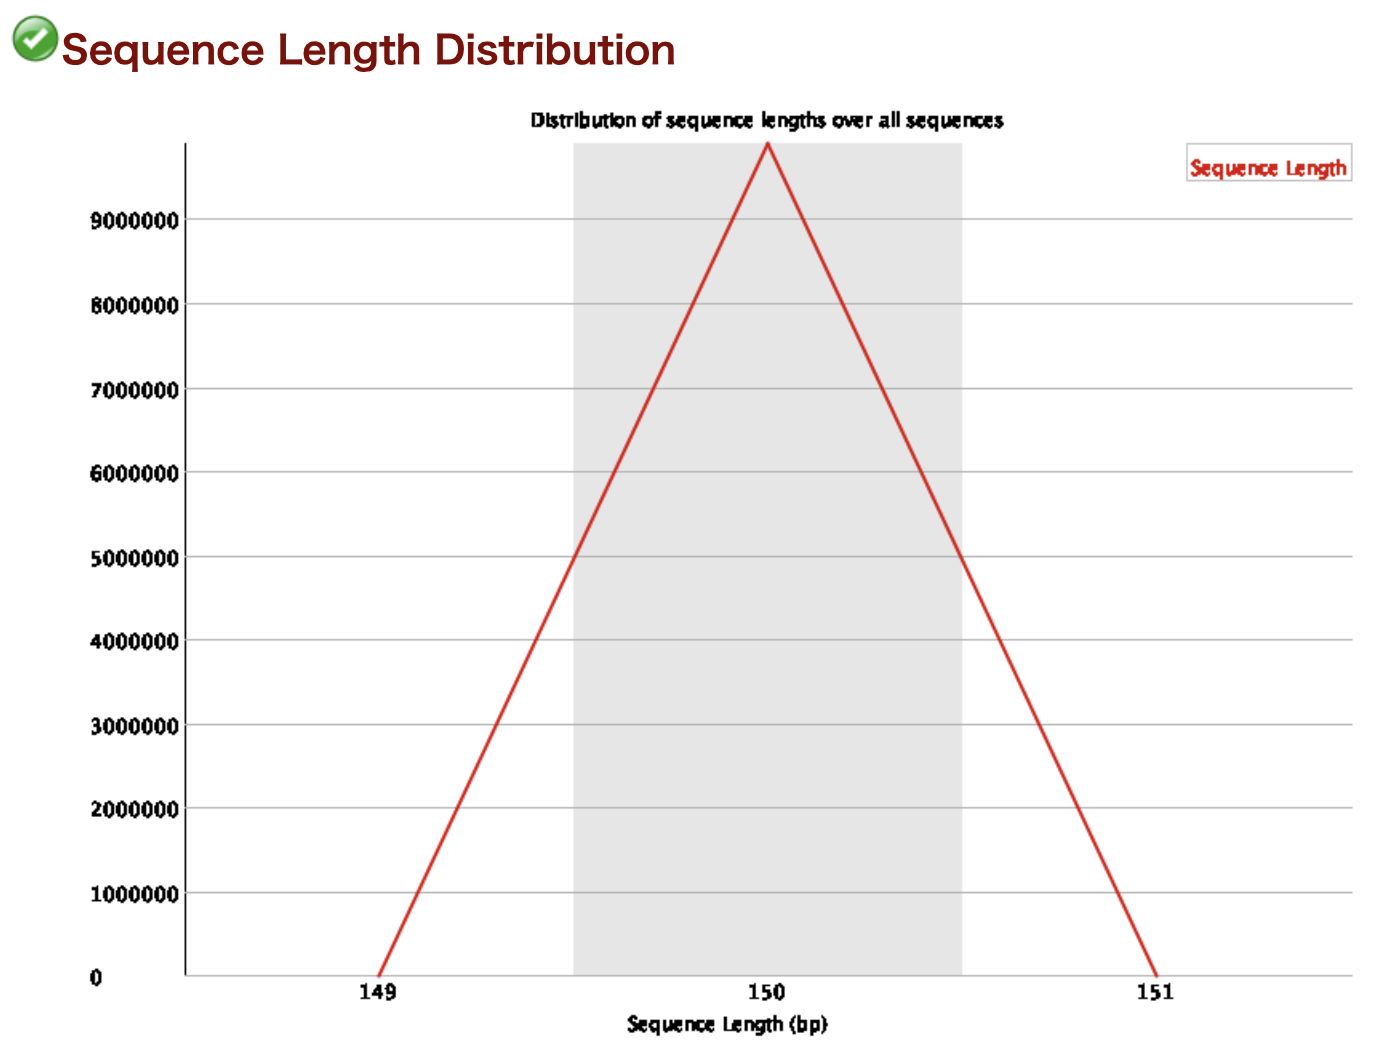
Sequence Length Distribution
Displays the distribution of read lengths. The horizontal axis represents the read length, and the vertical axis represents the number of reads.
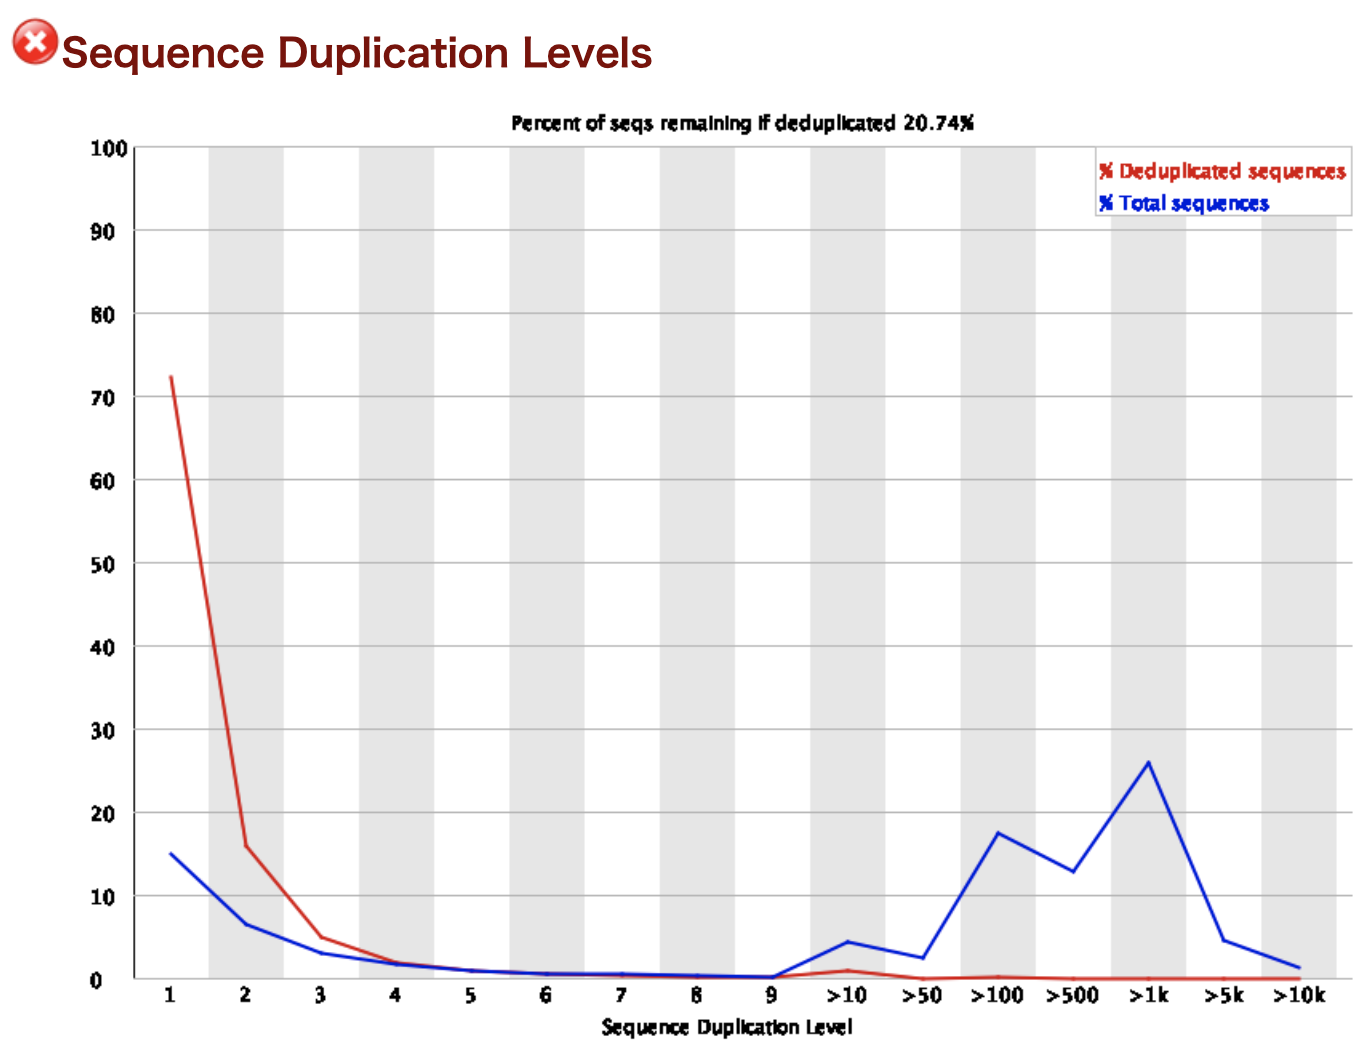
Sequence Duplication Levels
Indicates the level of duplication in the reads. The horizontal axis represents the number of times a read is duplicated, and the vertical axis represents the percentage of duplicated reads.
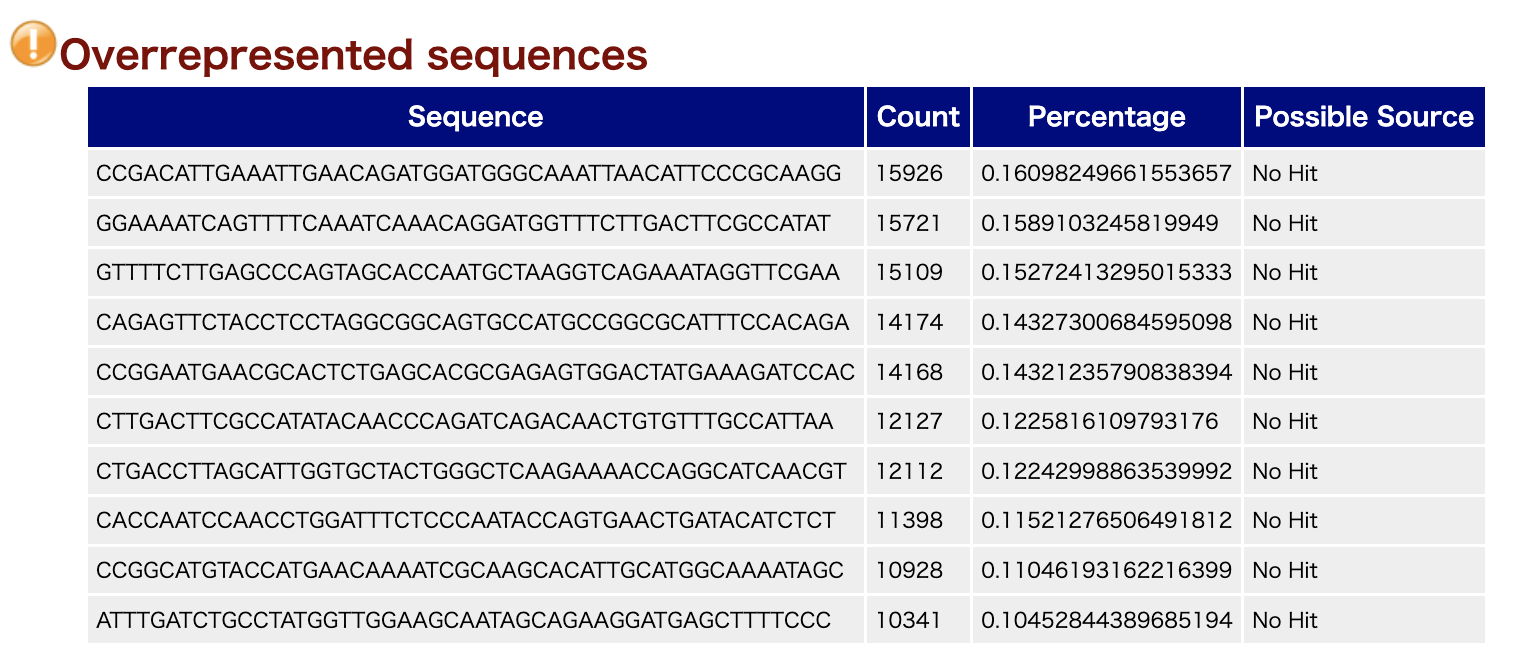
Overrepresented sequences
Displays sequences that appear frequently.
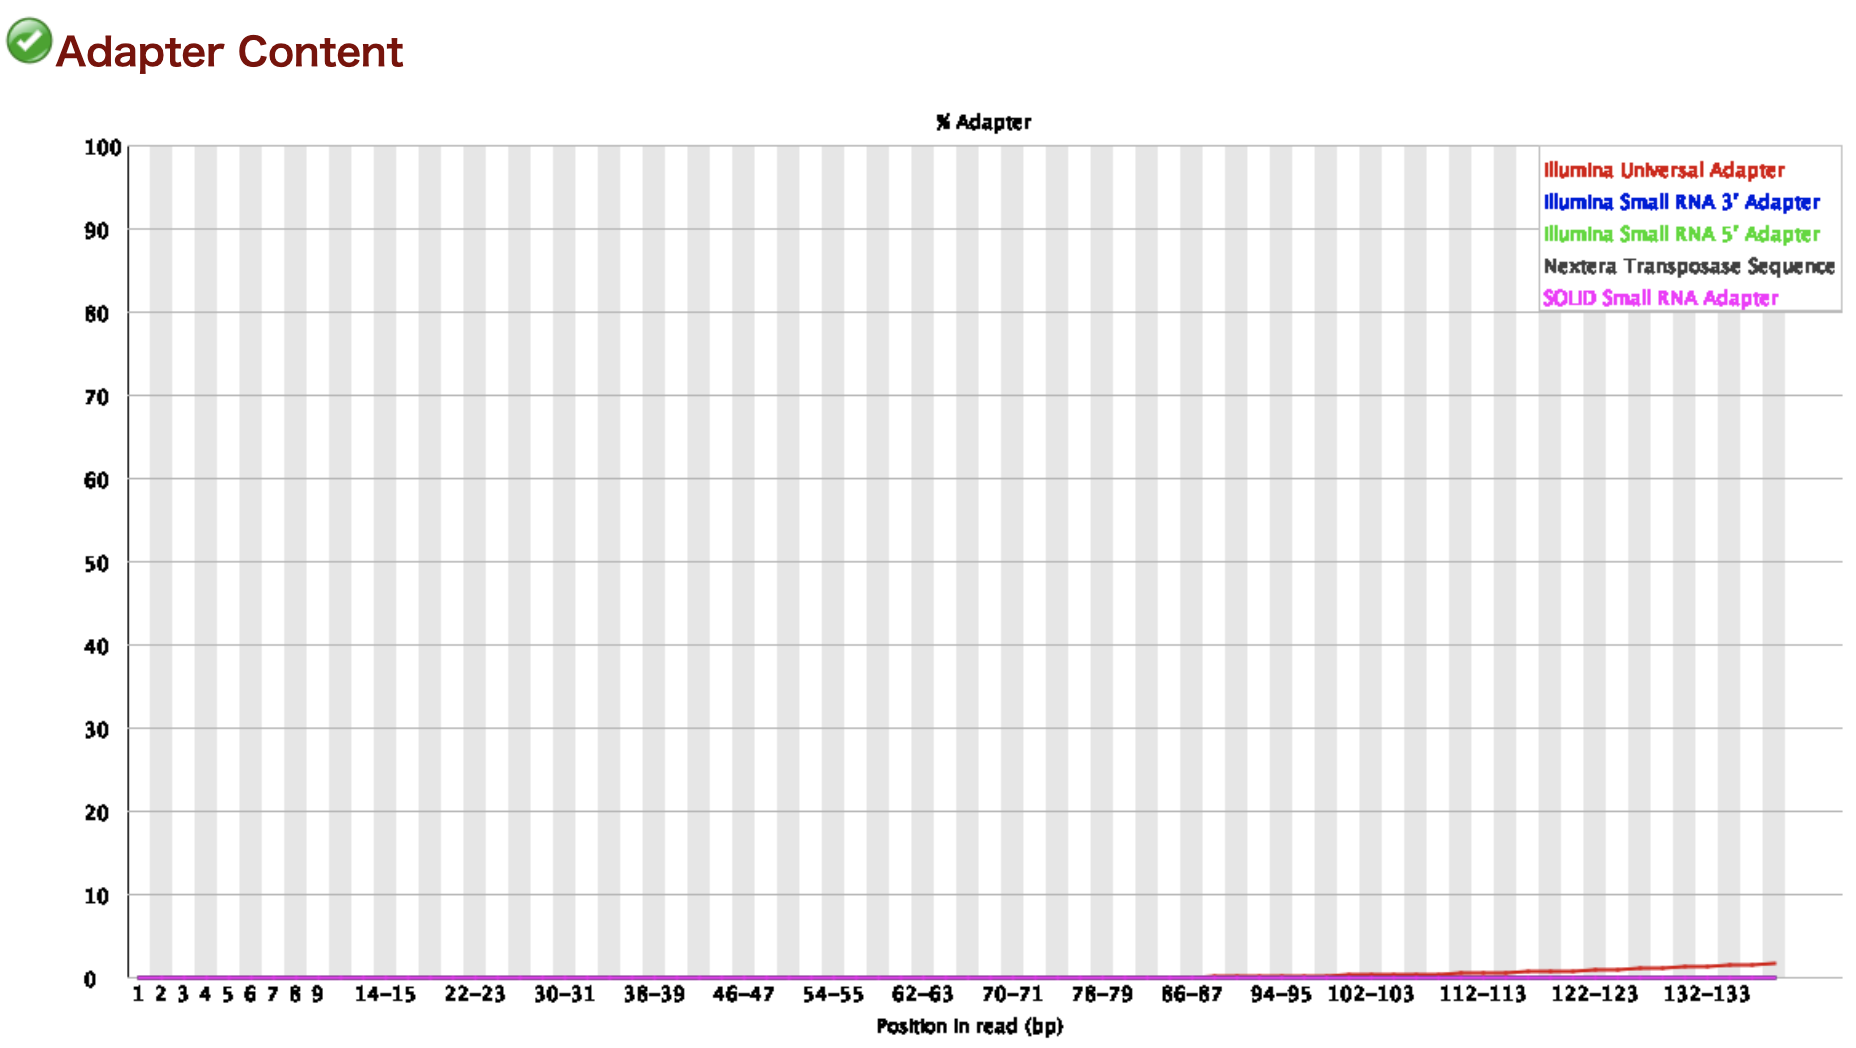
Adapter Content
Shows the proportion of adapter sequences at each position in the reads. The horizontal axis represents the position in the read, and the vertical axis represents the proportion.
RNA-Seq Data Analysis Software
This is an RNA-Seq Data Analysis Software recommended for those who:
✔︎ Seeking to avoid outsourcing or collaboration for RNA-Seq data analysis.
✔︎ Lacking time to learn RNA-Seq data analysis.
✔︎ Frustrated by the complexity of existing tools.
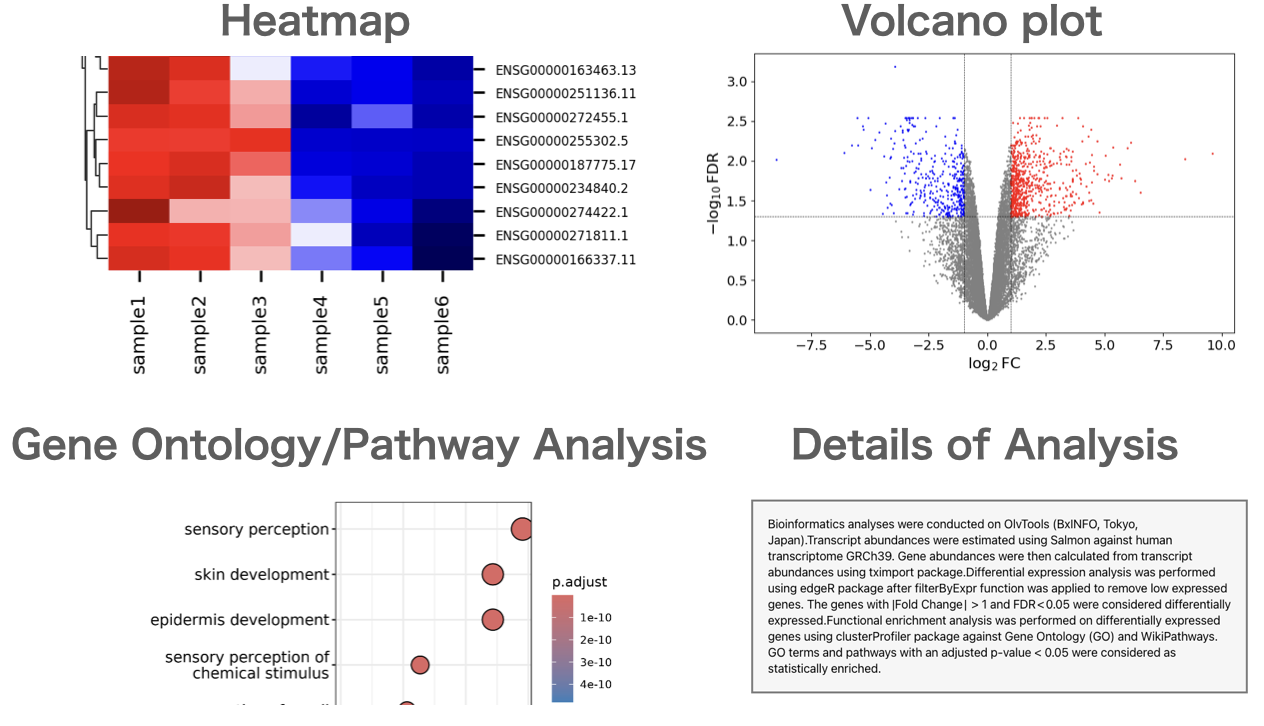
Users can perform gene expression quantification, identification of differentially expressed genes, gene ontology(GO) analysis, pathway analysis, as well as drawing volcano plots, MA plots, and heatmaps.
About the Author
BxINFO LLC
A research support company specializing in bioinformatics.
We provide tools and information to support life science research, with a focus on RNA-Seq analysis.