What is a FASTQ File and the FASTQ Format?
Introduction
A FASTQ file is a file written in the FASTQ format, containing nucleotide sequences and their corresponding quality scores (confidence levels). It is commonly used to represent nucleotide sequences output from sequencers.
The file extensions are often ".fastq" or ".fq". They are also frequently gzip-compressed, with extensions like ".fastq.gz" or ".fq.gz". Additionally, the reads output from next-generation sequencers (NGS) often come in pairs, making it easier to identify paired files by naming them as "[sample_name]_1.fastq.gz", "[sample_name]_1.fq.gz", "[sample_name]_2.fastq.gz", or "[sample_name]_2.fq.gz".
Files that contain only nucleotide sequences without quality scores are called FASTA files. For a detailed explanation of FASTA files, please see here.
FASTQ Format
In the FASTQ format, four lines constitute one set, representing the nucleotide sequence and its quality.
Example of a FASTQ file
In this example, there are 8 lines, displaying information for two sequences.
The information for each line is as follows:
| Contents | Example | |
|---|---|---|
| 1st Line | Sequence ID or description, starting with '@'. | @SRR21484222.626.1 626 length=51 |
| 2nd Line | Nucleotide sequence | GCCTTGGTGGTGAAATGGTAGACTGGAATTCTCGGGTGCCAAGGAACTCCA |
| 3rd Line | The "+" symbol is written. Sometimes the sequence ID is also included after it. | +SRR21484222.626.1 626 length=51 |
| 4th Line | Quality score | F:FFFFFFFFFFFFFFFFFFFFFFFFF:FFFFFFFFFFFF:,FFFFFFFFF |
Phred Quality Score
There are several ways to represent the quality score, but the Phred quality score is commonly used.
The Phred quality score is calculated using the following formula:
\(p_{err}\) represents the probability that the sequencing result is an error.
In other words, Q10 corresponds to a 10% probability of error, Q20 to 1%, Q30 to 0.1%, and Q40 to 0.01%.
In a FASTQ file, this quality score is represented by a single character.
Below is the table showing the correspondence between characters and scores.
Quality Score | Character |
|---|---|
| 0 | ! |
| 1 | " |
| 2 | # |
| 3 | $ |
| 4 | % |
| 5 | & |
| 6 | ' |
| 7 | ( |
| 8 | ) |
| 9 | * |
| 10 | + |
| 11 | , |
| 12 | - |
| 13 | . |
| 14 | / |
| 15 | 0 |
| 16 | 1 |
| 17 | 2 |
| 18 | 3 |
| 19 | 4 |
| 20 | 5 |
| 21 | 6 |
| 22 | 7 |
| 23 | 8 |
| 24 | 9 |
| 25 | : |
| 26 | ; |
| 27 | < |
| 28 | = |
| 29 | > |
| 30 | ? |
| 31 | @ |
| 32 | A |
| 33 | B |
| 34 | C |
| 35 | D |
| 36 | E |
| 37 | F |
| 38 | G |
| 39 | H |
| 40 | I |
RNA-Seq Data Analysis Software
This is an RNA-Seq Data Analysis Software recommended for those who:
✔︎ Seeking to avoid outsourcing or collaboration for RNA-Seq data analysis.
✔︎ Lacking time to learn RNA-Seq data analysis.
✔︎ Frustrated by the complexity of existing tools.

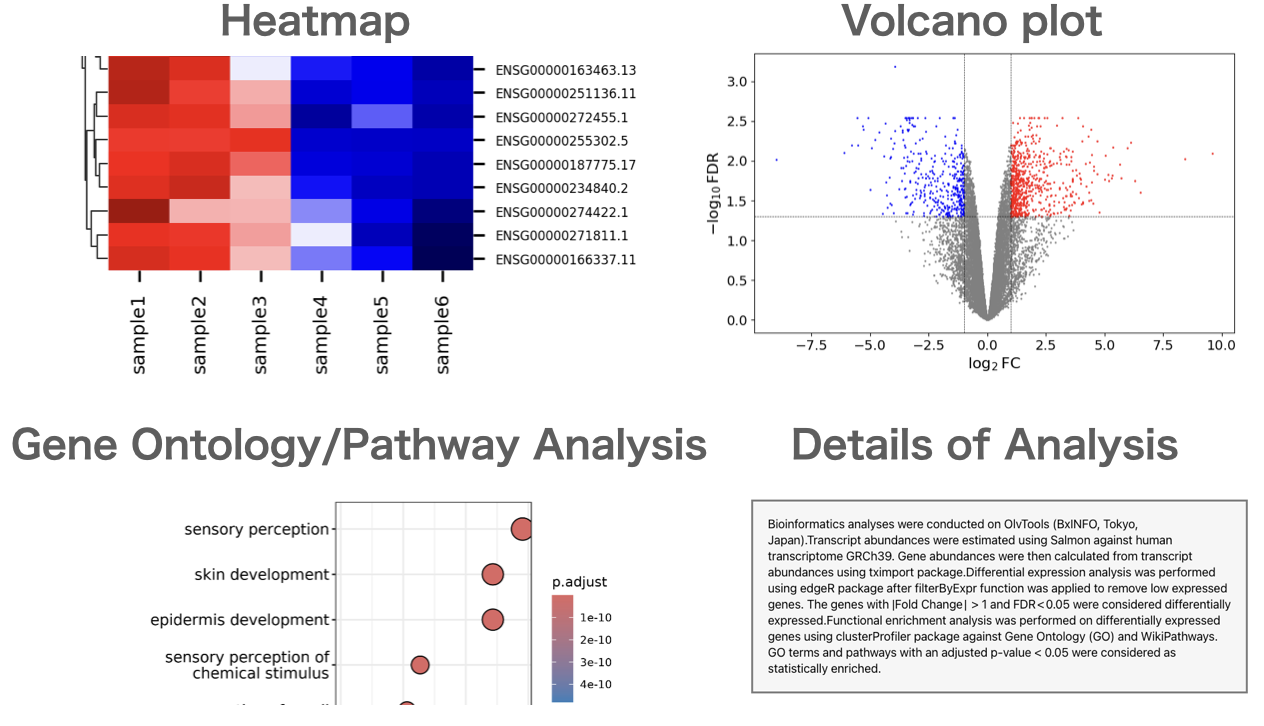
Users can perform gene expression quantification, identification of differentially expressed genes, gene ontology(GO) analysis, pathway analysis, as well as drawing volcano plots, MA plots, and heatmaps.
About the Author
BxINFO LLC
A research support company specializing in bioinformatics.
We provide tools and information to support life science research, with a focus on RNA-Seq analysis.