Heatmap in RNA-Seq Analysis
In RNA-Seq analysis, a heatmap is an important method for visualizing gene expression patterns.
What is a heatmap?
It is a figure that visualizes the magnitude of numerical data in a matrix format using color variations.
It is used in various fields, not just for molecular biology. For example, it can be used to visualize the areas of a webpage that users frequently view.
How to Interpret a Heatmap in RNA-Seq Analysis
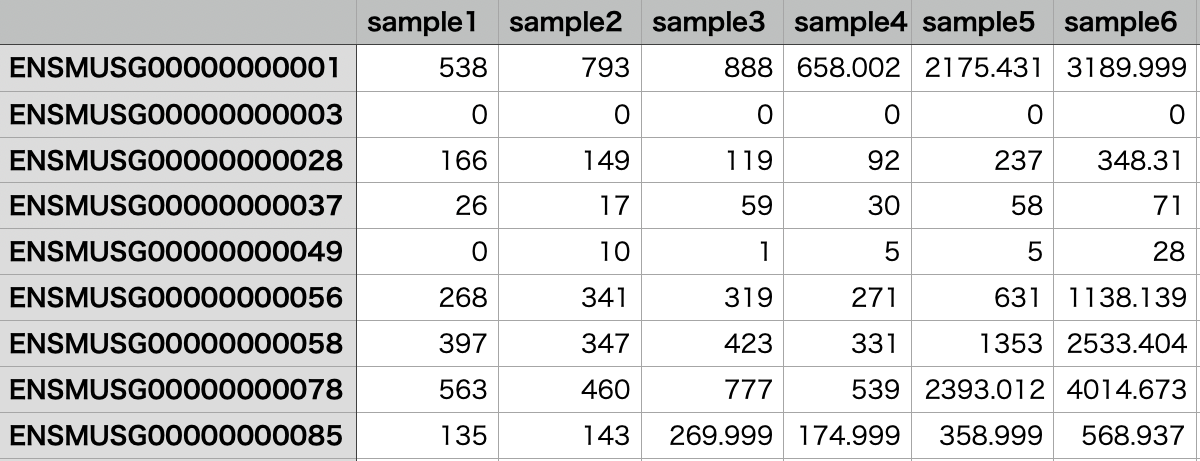
When performing RNA-Seq analysis, you will obtain a gene expression table like the one shown below. (The image displays only 10 genes, but in reality, it spans tens of thousands of rows.)

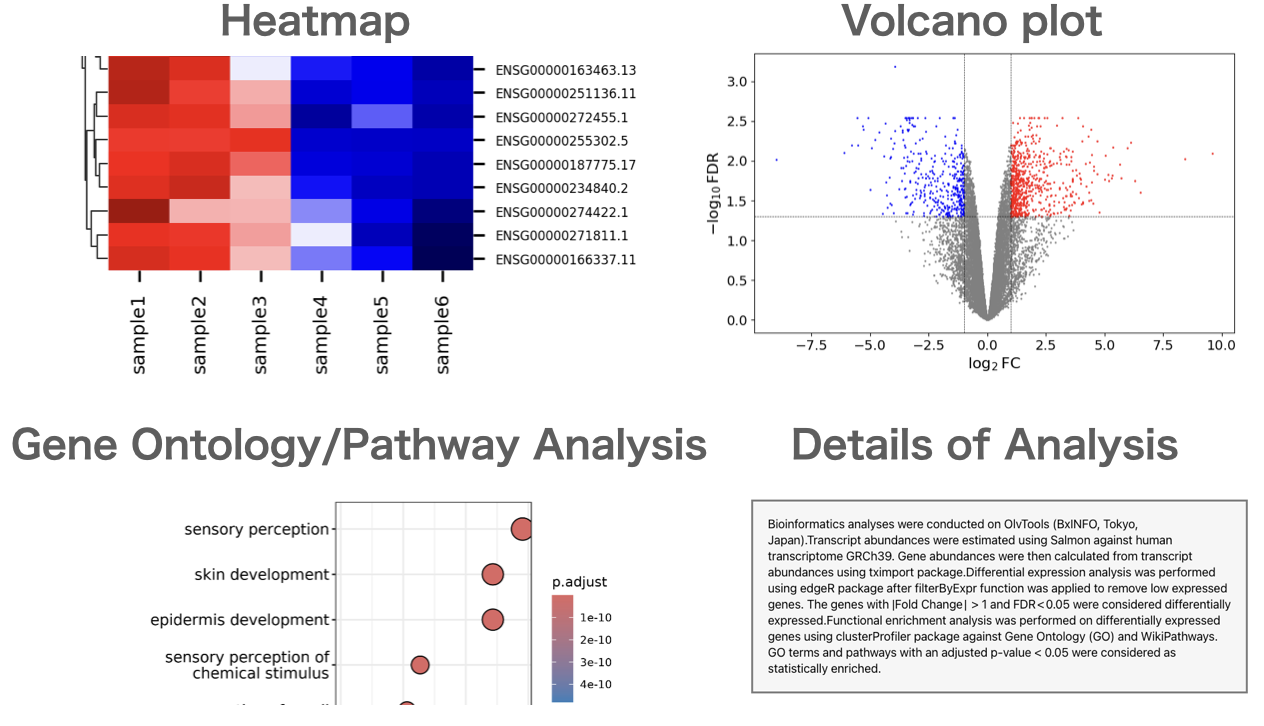
Visualizing data like this with a heatmap looks as follows:

In a heatmap for RNA-Seq analysis, the horizontal axis typically represents samples, and the vertical axis represents genes.
In the figure above, red indicates high gene expression, white indicates medium gene expression, and blue indicates low gene expression.
In the lower half of the genes, you can see an increase in expression in sample1, sample2, and sample3, while in the upper half, there is an increase in expression in sample4, sample5, and sample6.
In a heatmap for RNA-Seq analysis, gene expression is often represented using red, black, and green colors as well.
Additionally, a heatmap in RNA-Seq analysis is often drawn after performing hierarchical clustering. Therefore, in the figure above, genes with similar expression patterns are placed close to each other.
In this example, only gene clustering is performed, but sometimes clustering of the samples is also done before drawing the heatmap.
RNA-Seq Data Analysis Software
This is an RNA-Seq Data Analysis Software recommended for those who:
✔︎ Seeking to avoid outsourcing or collaboration for RNA-Seq data analysis.
✔︎ Lacking time to learn RNA-Seq data analysis.
✔︎ Frustrated by the complexity of existing tools.

Users can perform gene expression quantification, identification of differentially expressed genes, gene ontology(GO) analysis, pathway analysis, as well as drawing volcano plots, MA plots, and heatmaps.
About the Author
BxINFO LLC
A research support company specializing in bioinformatics.
We provide tools and information to support life science research, with a focus on RNA-Seq analysis.