Gene Ontology Analysis in RNA-Seq: Understanding the Basics
GO analysis, short for Gene Ontology analysis or Gene Ontology enrichment analysis, is a method for identifying gene functions that are significantly overrepresented in a specific gene set compared to a background gene set. It is commonly utilized to interpret the functions of differentially expressed genes obtained from RNA-Seq analysis results.
What is Gene Ontology?
Gene Ontology, abbreviated as GO, is a common vocabulary for describing gene functions.
It is divided into three categories:
Biological Process(BP)
This category describes the metabolic and signaling pathways in which the gene product is involved, such as apoptosis and the cell cycle.
Cellular Component(CC)
This category describes the location where the gene product can be found, such as cell membrane and mitochondria.
Molecular Function(MF)
This category describes the biochemical activity of the gene product, such as enzyme activity and ligand binding.
Each concept in Gene Ontology is assigned an identifier known as a GO term, which is hierarchically structured. When a gene is associated with a lower-level GO term, it is also considered to be associated with related higher-level GO terms.
The relationships between GO terms are also defined, and the following terms are primarily used:
| Relation | Description | Example |
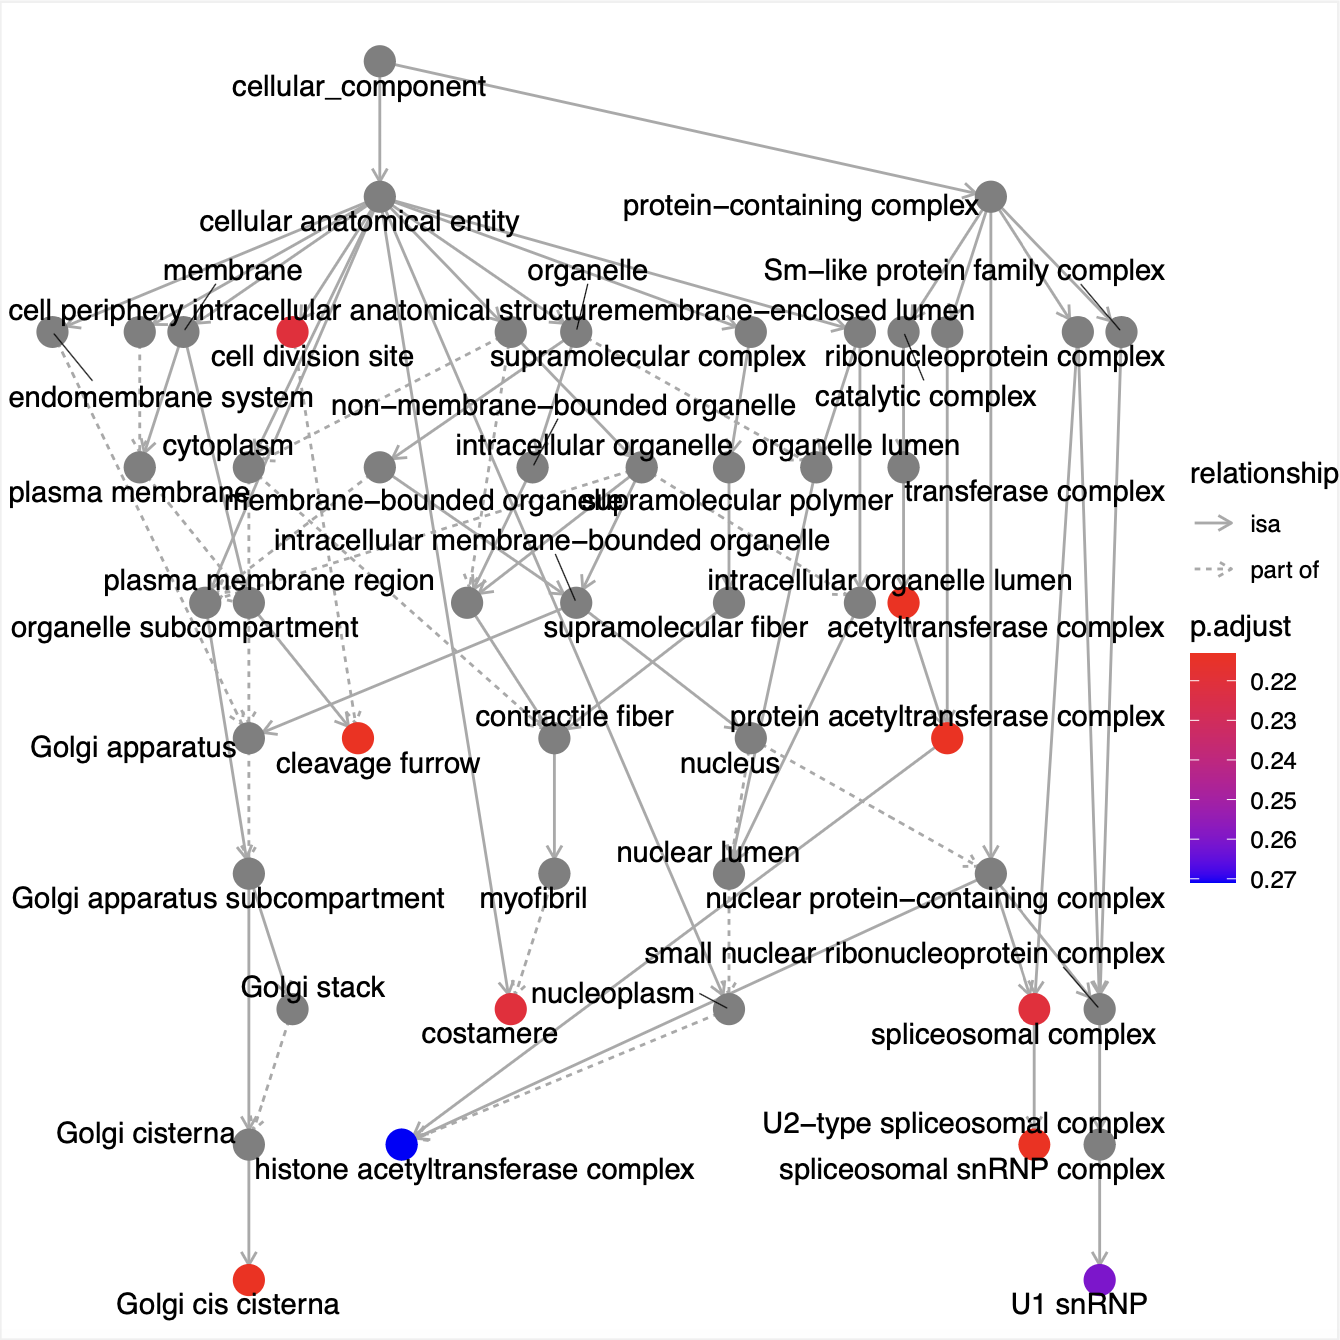
| is a | The relation 'B is a A' means that B is a subtype of A. | mitotic cell cycle is a cell cycle |
| part of | The part of relation is used to represent part-whole relationships. | inner mitochondrial membrane is part of mitochondrion |
Example of Gene Ontology

What is Gene Ontology Analysis?
Gene Ontology analysis identifies GO terms that are significantly overrepresented in a specific gene set compared to the background gene set. Suppose that an RNA-Seq analysis reveals 357 differentially expressed genes, of which 13 out of 357 are associated with the GO term "GO:0007156", and in a background gene set of 9975 genes, 71 out of 9975 are associated with "GO:0007156". In this case, the term "GO:0007156" would be considered significantly overrepresented compared to its expected frequency of a random sampling of 357 genes from the background set.
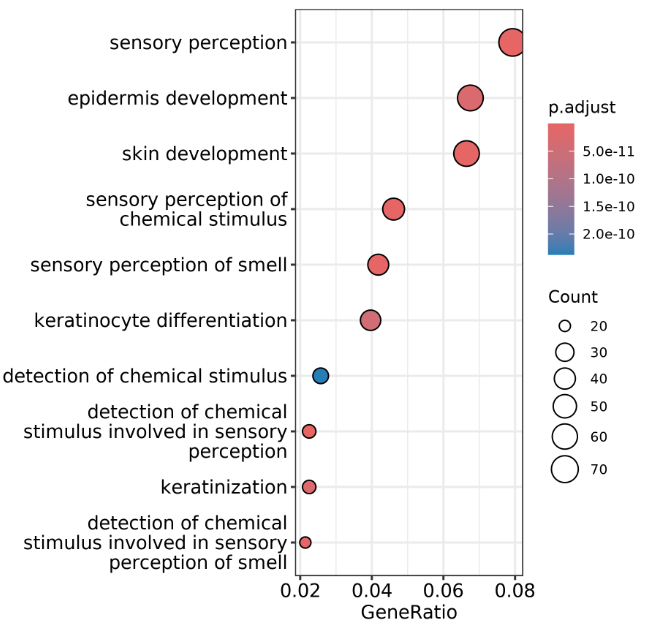
Example of Gene Ontology Analysis Result

The results of gene ontology analysis can be visualized using a dot plot. The size of each circle represents the number of genes associated with the GO term, and the color indicates the p-value.
Example of Dot Plot

How to Counduct Gene Ontology Analysis
Gene Ontology analysis can be conducted using packages like clusterProfiler, topGO, and GOseq. When working with raw data of RNA-Seq analysis, it is necessary to quantify gene expression and identify differentially expressed genes before proceeding with Gene Ontology analysis. We provide RNA-Seq Data Analysis Software that can perform Gene Ontology analysis starting from raw data of RNA-Seq analysis.

RNA-Seq Data Analysis Software: Accelerate Your Publication
With our RNA-Seq data analysis software, you won't need to outsource or rely on collaborators. You can start analyzing the data yourself right away, without the need for high-spec computers or knowledge of Linux commands.

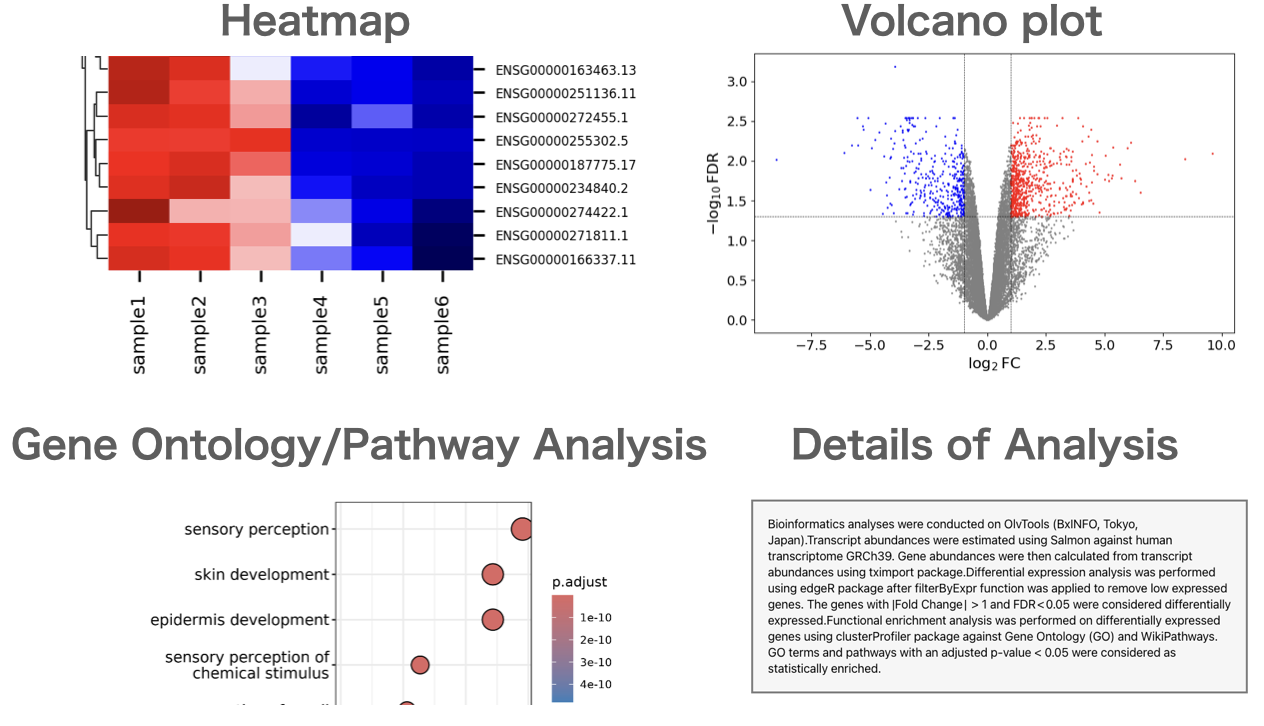
Users can perform gene expression quantification, identification of differentially expressed genes, gene ontology(GO) analysis, pathway analysis, as well as drawing volcano plots, MA plots, and heatmaps.
About the Author
BxINFO LLC
A research support company specializing in bioinformatics.
We provide tools and information to support life science research, with a focus on RNA-Seq analysis.