edgeR: A Tutorial for Differential Expression Analysis in RNA-Seq Data
What is edgeR?
RNA-Seq analysis using next-generation sequencing allows for the measurement of gene expression levels for each gene. By comparing these quantitative results of gene expression across multiple samples, differentially expressed genes can be identified through comparisons between sample groups.
This page provides a tutorial on how to use and install edgeR, a software for identifying differentially expressed genes.
If you find the following procedures difficult, we also offer a web-based software that allows you to easily identify differentially expressed genes.
Installing DESeq2
First, if R is not already installed, install R. (The following is an example of installation using Homebrew.)
Launch R and execute the following to install BiocManager and edgeR.
Execute the following, and if no errors are displayed, the installation is successful.
Preparing Data
Using software such as featureCounts, StringTie, and RSEM, obtain quantitative results of gene expression levels.
Ultimately, the data was organized into a comma-separated file (CSV file) as shown below. Please note that the file input into DESeq2 should be raw read counts, not normalized data such as FPKM/RPKM or TPM.

How to Use edgeR
The count data is loaded and combined with the group information to create a DGEList object. In this analysis, the samples were divided into two groups for comparison: samples 1 to 4 as Group A and samples 5 to 8 as Group B.
The genes with low expression were filtered using filterByExpr. In this example, the number of genes was reduced from 35,627 to 14,698.
TMM normalization was performed using calcNormFactors to correct for biases between samples.
Finally, quasi-likelihood F-tests are performed.
Differentially expressed genes were identified. The explanation of logFC can be found here. In logCPM, CPM stands for Counts Per Million.
The rows with FDR < 0.05 can be extracted as follows.
FDR stands for False Discovery Rate. When extracting with FDR < 0.05, it means that among the extracted genes, the proportion of genes that are not actually differentially expressed (false positives) is 5%.
What is TMM Normalization?
TMM normalization is a method for correcting gene expression levels in RNA-Seq analysis, implemented in the edgeR software.
In RNA-Seq, what can be measured is not the absolute expression level, but the relative expression level. Therefore, when a few genes are highly expressed, it can appear that the expression levels of other genes are relatively reduced. TMM normalization addresses this by adjusting to minimize differences in expression levels between samples. Using this method, it is possible to make appropriate adjustments for data in which the expression of most genes does not vary between samples.
It should be noted that TMM normalization does not adjust for common factors between samples. For instance, gene length is said to correlate with read counts, with longer genes having higher read counts, but TMM normalization does not correct for this. In edgeR, the focus is on identifying differentially expressed genes, so adjustments between genes are not necessary. Therefore, TMM normalization is sufficient.
On the other hand, normalization methods such as FPKM/RPKM and TPM also account for gene length to enable comparisons of expression levels between genes.
RNA-Seq Data Analysis Software
This is an RNA-Seq Data Analysis Software recommended for those who:
✔︎ Seeking to avoid outsourcing or collaboration for RNA-Seq data analysis.
✔︎ Lacking time to learn RNA-Seq data analysis.
✔︎ Frustrated by the complexity of existing tools.

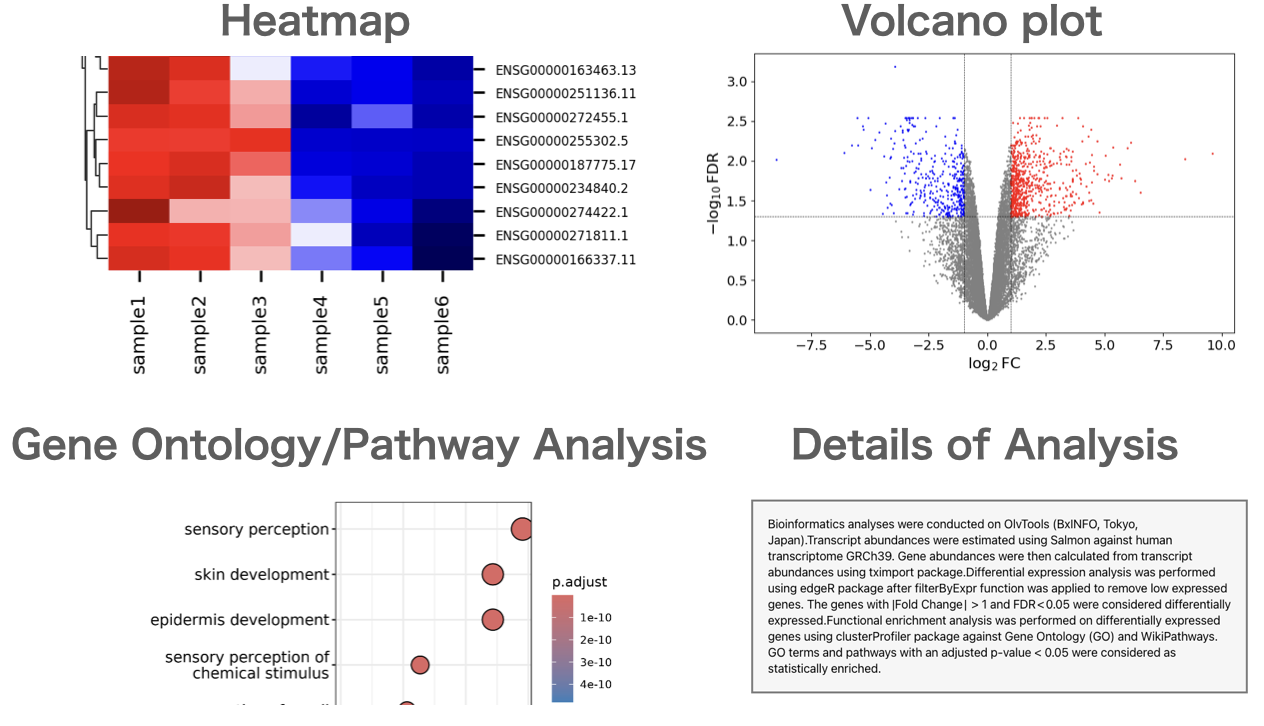
Users can perform gene expression quantification, identification of differentially expressed genes, gene ontology(GO) analysis, pathway analysis, as well as drawing volcano plots, MA plots, and heatmaps.
About the Author
BxINFO LLC
A research support company specializing in bioinformatics.
We provide tools and information to support life science research, with a focus on RNA-Seq analysis.