What is TPM? Understanding Normalization Methods for Gene Expression Levels in RNA-Seq Analysis
Introduction
The raw count obtained from RNA-Seq analysis cannot be directly compared between genes or samples.
This is because the longer the gene, the more reads are mapped to it, and the greater the total number of reads obtained by sequencing, the more reads are mapped to each gene in that sample.
Therefore, various normalization methods have been proposed, but this page focuses on explaining TPM. Previously, the metrics FPKM/RPKM were widely used. However, they have been criticized for not adequately representing gene expression levels. Currently, TPM is increasingly being utilized.
Definition of TPM
TPM stands for 'transcripts per million' and was proposed as an alternative normalization method to FPKM/RPKM.
Like FPKM/RPKM, TPM also normalizes the total number of mapped reads to one million and the transcript length to 1,000 bases. However, the order of normalization is different: TPM first adjusts for length, then for the total number of reads.
The formula is as follows (where \(q_i\) represents the number of mapped reads, and \(l_i\) represents the transcript length):
Using FPKM, it can also be expressed as follows:
Effective length
The calculation method for TPM varies slightly depending on the software. For example, some software may use the effective length instead of the actual transcript length for \(l_i\).
The effective length can be calculated as follows:
\(μ_{FLD}\) represents the average fragment length.
It is said that using the effective length in the calculation of TPM allows for a more appropriate correction for the effects of length.
RNA-Seq Data Analysis Software
This is an RNA-Seq Data Analysis Software recommended for those who:
✔︎ Seeking to avoid outsourcing or collaboration for RNA-Seq data analysis.
✔︎ Lacking time to learn RNA-Seq data analysis.
✔︎ Frustrated by the complexity of existing tools.

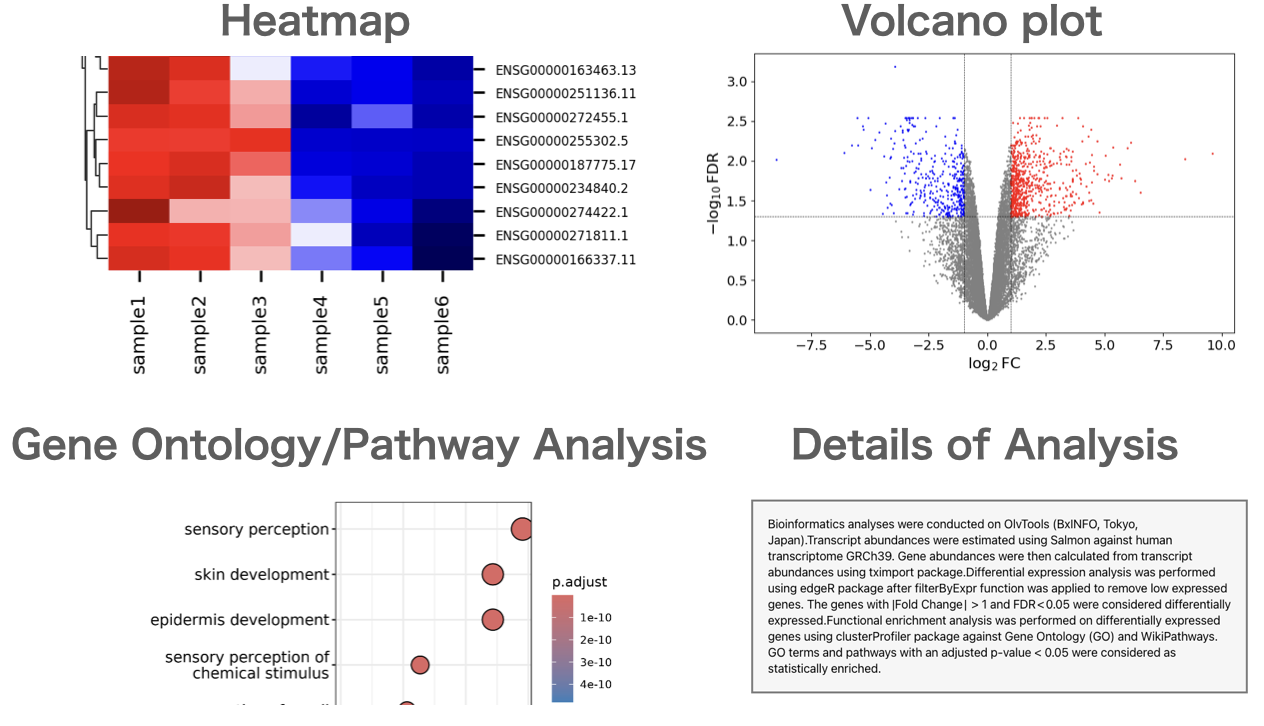
Users can perform gene expression quantification, identification of differentially expressed genes, gene ontology(GO) analysis, pathway analysis, as well as drawing volcano plots, MA plots, and heatmaps.
About the Author
BxINFO LLC
A research support company specializing in bioinformatics.
We provide tools and information to support life science research, with a focus on RNA-Seq analysis.