Using featureCounts for Quantification of Gene Expression in RNA-seq Analysis
Introduction
When performing RNA-seq analysis using next-generation sequencing, raw data called FASTQ files (reads) are obtained. After mapping each read to a reference sequence, gene expression levels are quantified by counting the reads that are mapped to each gene.
This page explains how to use featureCounts, a software for counting reads.
Installing featureCounts
It is easy to install using Bioconda. Since featureCounts is included in the Subread package, it is necessary to install Subread.
Let's display the help.
If it displays as follows, the installation is successful.
Conducting Read Counting
Read counting is performed using the following command. The analysis is conducted on four samples: sample1, sample2, sample3, and sample4.
Explanation of Options
| Option | Description |
| -p | This option is used in the case of paired reads when counting fragments instead of individual reads. |
| -t | This option specifies the feature type in the GTF file that is targeted for read counting. The default is 'exon'. |
| -g | This option specifies the attribute in the GTF file to be used as the unit of read counting. The default is 'gene_id'. |
In this example, read counting is done using fragments instead of reads, and reads mapped to exons are targeted for aggregation, with the aggregation performed by gene_id.
Results
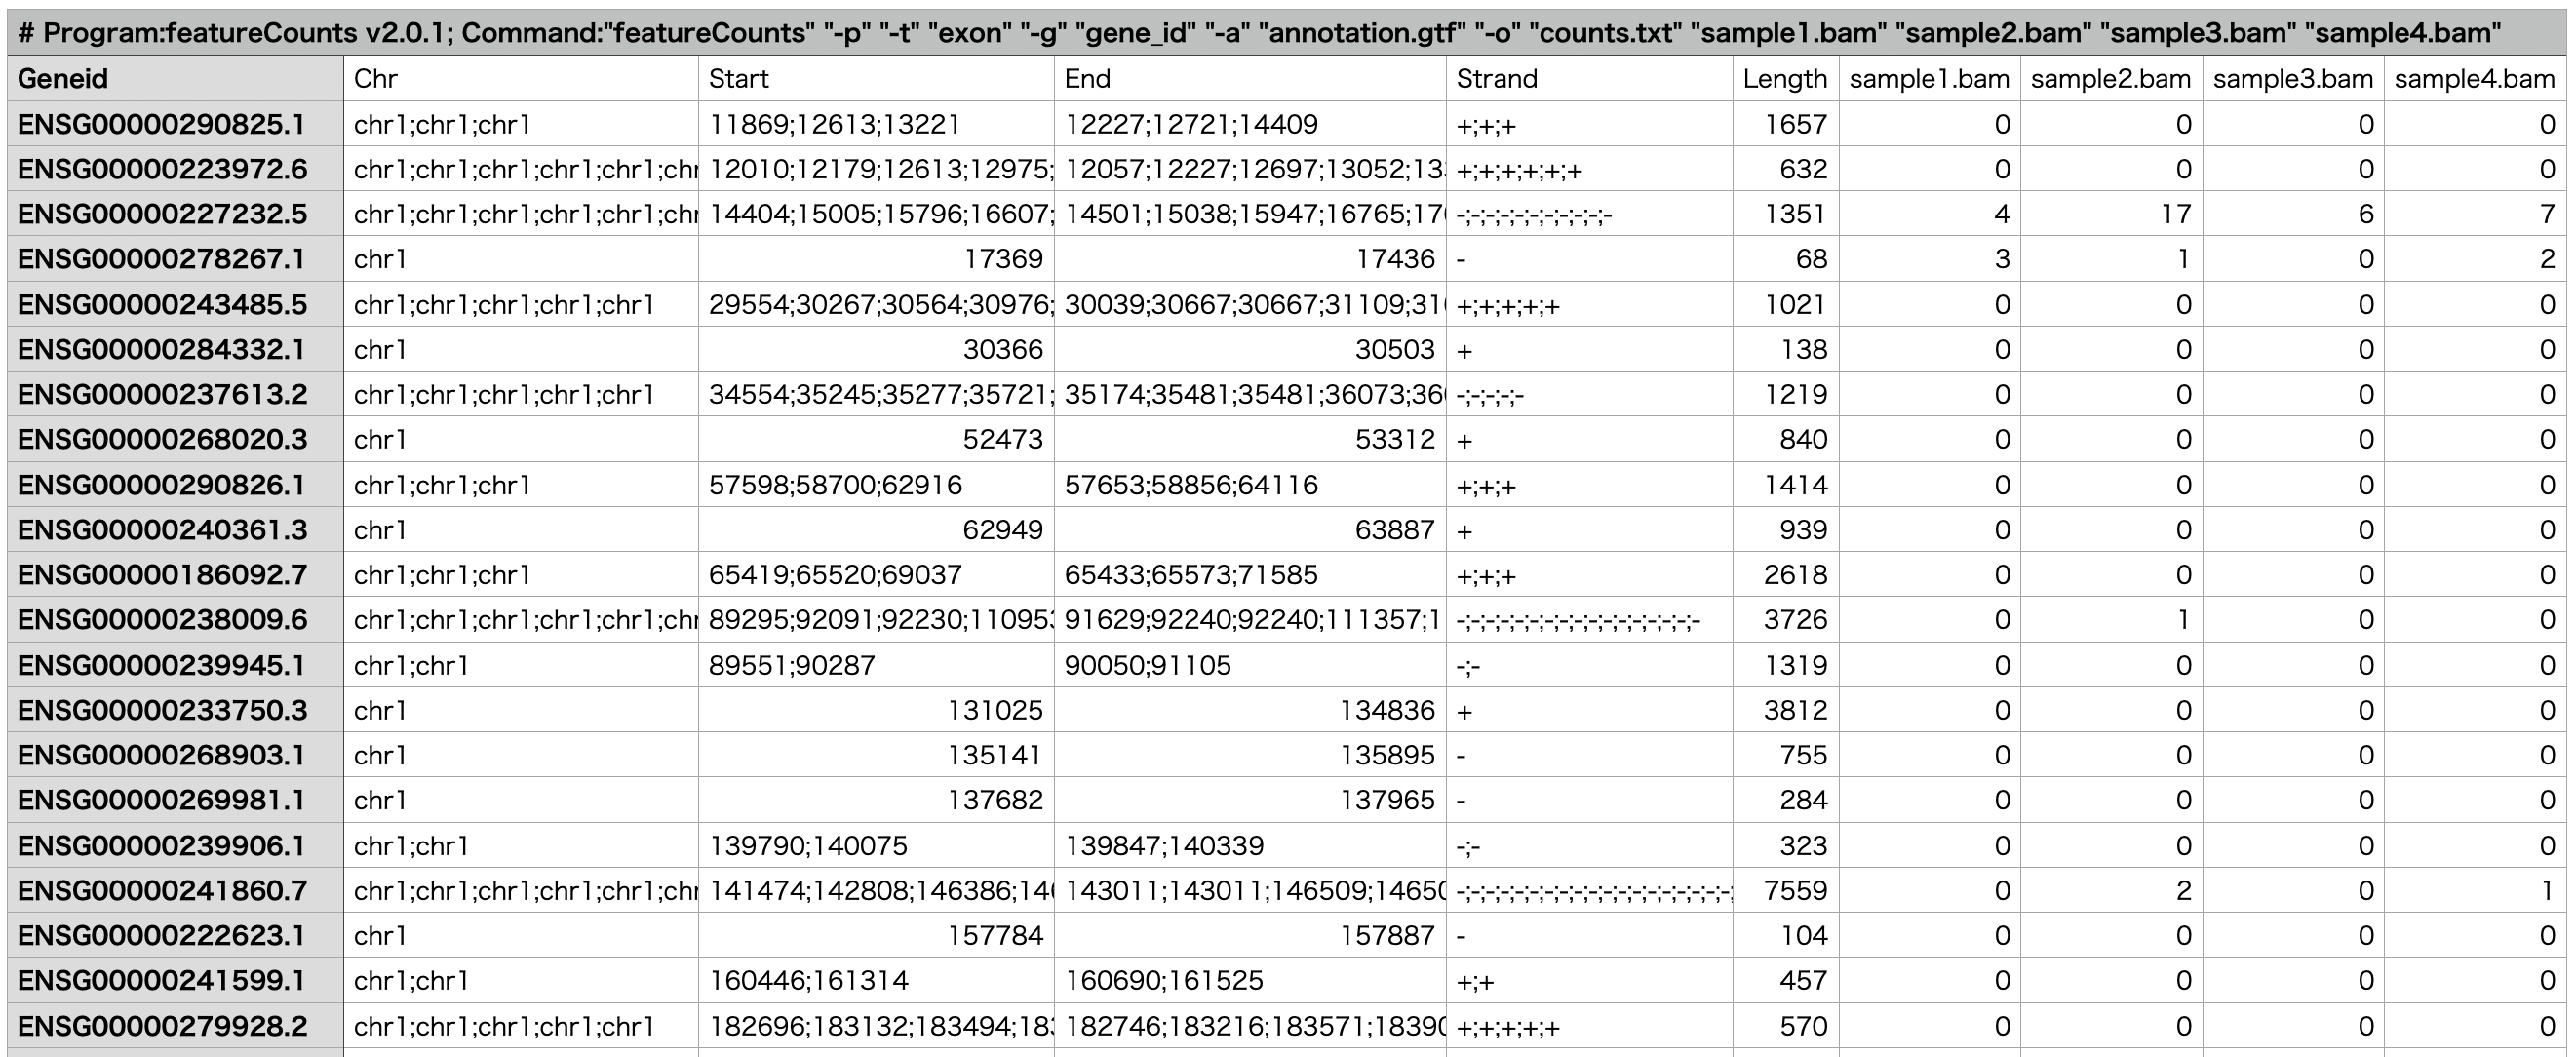
The following results were obtained.

In the first line, the version of featureCounts used and the command are noted, and starting from the seventh column, the results of the read counts are displayed.
The contents of columns 1 to 6 are as follows.
| Column Number | Column Name | Description |
| 1 | Geneid | Gene ID |
| 2 | Chr | Chromosom |
| 3 | Start | The starting positions of exons; listed for all exons separated by semicolons. |
| 4 | End | The ending positions of exons; listed for all exons separated by semicolons. |
| 5 | Strand | The orientation of exons; listed for all exons separated by semicolons. |
| 6 | Length | The length of the gene; if there is overlap among exons, it is shorter than the total length of all exons. |
RNA-Seq Data Analysis Software
This is an RNA-Seq Data Analysis Software recommended for those who:
✔︎ Seeking to avoid outsourcing or collaboration for RNA-Seq data analysis.
✔︎ Lacking time to learn RNA-Seq data analysis.
✔︎ Frustrated by the complexity of existing tools.

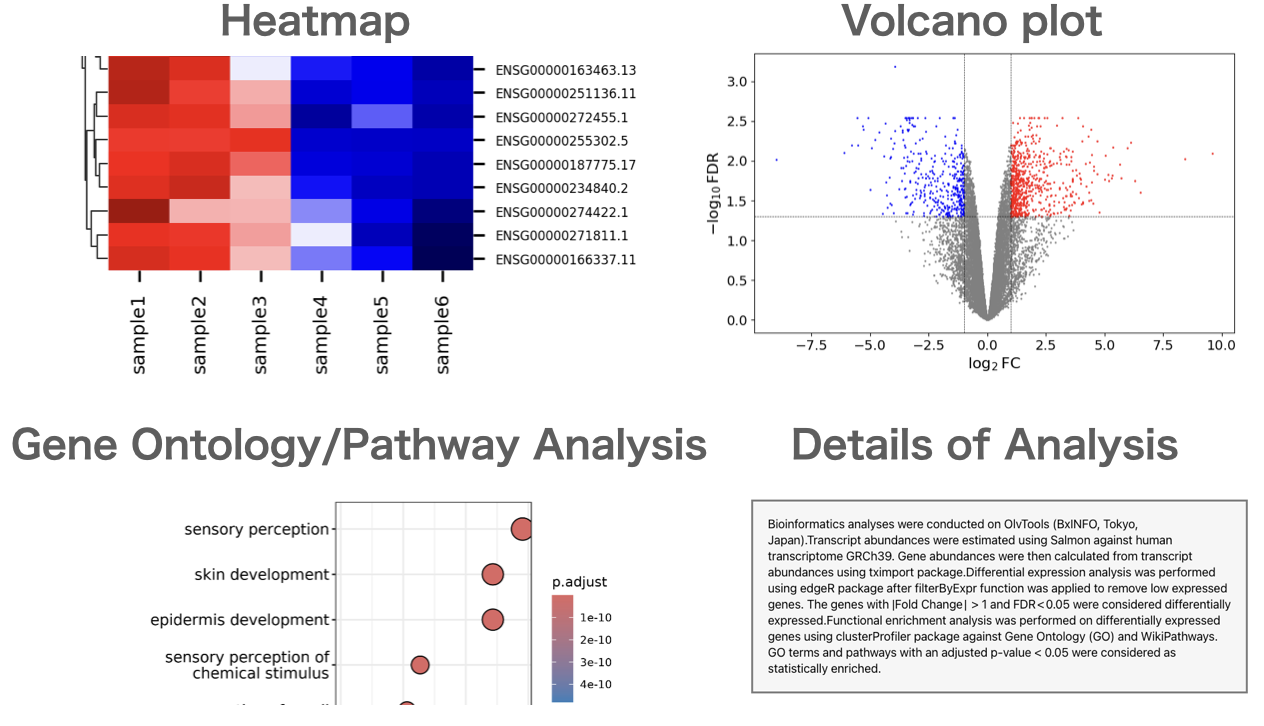
Users can perform gene expression quantification, identification of differentially expressed genes, gene ontology(GO) analysis, pathway analysis, as well as drawing volcano plots, MA plots, and heatmaps.
About the Author
BxINFO LLC
A research support company specializing in bioinformatics.
We provide tools and information to support life science research, with a focus on RNA-Seq analysis.