RSEM Tutorial: Gene & Isoform Quantification for RNA-Seq
Introduction
When performing RNA-Seq analysis with a next-generation sequencer, you obtain raw data in the form of FASTQ files. After mapping these reads to a reference sequence, gene expression levels are quantified by counting the reads that align to each gene.
This page explains how to use RSEM, a tool for estimating expression levels at both the gene and isoform levels from alignment results.
Installation
RSEM can be installed via Bioconda.
Try displaying the help message to verify the installation.
If you see output similar to the following, the installation was successful.
Building the Index
Build an index using the following command. Since RSEM can handle the mapping step internally, you can also create the alignment index at this stage. You can choose from Bowtie, Bowtie2, STAR, or HISAT2 as the aligner; this example uses HISAT2.
Read Counting
The following command performs both the mapping and the read counting in a single step.
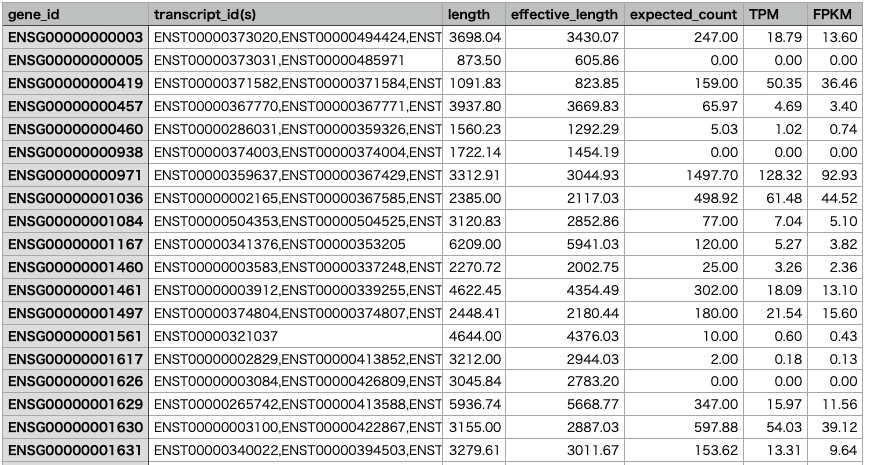
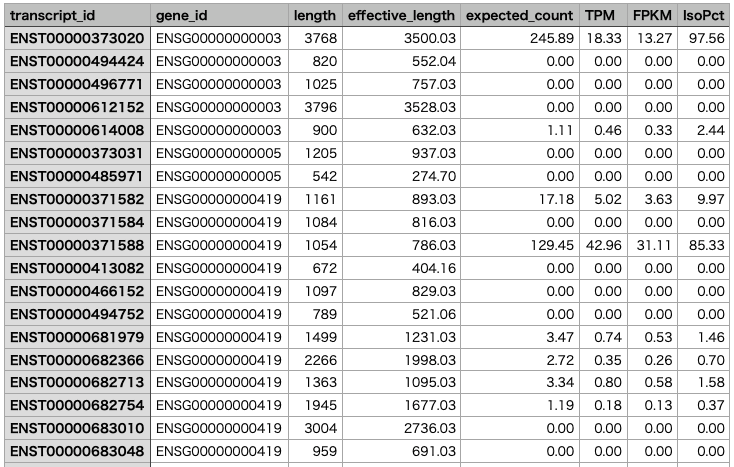
The gene-level results are saved in "sample1.genes.results", and the isoform-level results are saved in "sample1.isoforms.results".
Merging Results
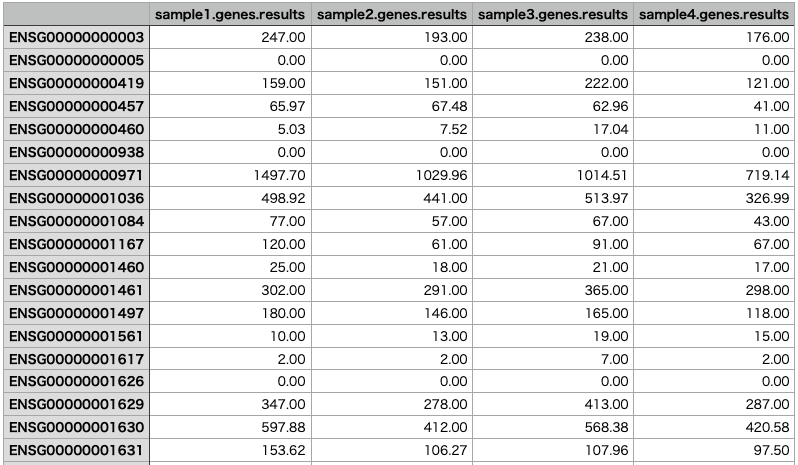
Once you have analyzed multiple samples, you can merge the results into a single matrix. Here we merge the results for sample1 through sample4.
The merged results will look like this:

RNA-Seq Data Analysis Software
This is an RNA-Seq Data Analysis Software recommended for those who:
✔︎ Seeking to avoid outsourcing or collaboration for RNA-Seq data analysis.
✔︎ Lacking time to learn RNA-Seq data analysis.
✔︎ Frustrated by the complexity of existing tools.

Users can perform gene expression quantification, identification of differentially expressed genes, gene ontology(GO) analysis, pathway analysis, as well as drawing volcano plots, MA plots, and heatmaps.
About the Author


BxINFO LLC
A research support company specializing in bioinformatics.
We provide tools and information to support life science research, with a focus on RNA-Seq analysis.