Principal Component Analysis (PCA) in RNA-Seq Analysis
In RNA-Seq analysis, Principal Component Analysis (PCA) is often performed to visualize the similarity in gene expression between samples.
What is Principal Component Analysis (PCA)?
Principal Component Analysis (PCA) is a method that transforms high-dimensional data into a lower dimension while minimizing the loss of information.
First, the axis where the data variance is maximized is identified as the first principal component (PC1). The second principal component (PC2) is the axis that maximizes variance among those axes orthogonal to PC1. The third principal component (PC3) is the axis that maximizes variance among those axes orthogonal to both PC1 and PC2. Similarly, the fourth principal component (PC4), fifth principal component (PC5), and so on, are determined.
Additionally, there is a metric known as the "explained variance ratio," which indicates how much of the data each principal component explains. Furthermore, the sum of the explained variance ratios up to the m-th principal component is referred to as the "cumulative explained variance ratio." For example, if the explained variance ratio of the first principal component is 50%, and the second principal component is 30%, then the cumulative explained variance ratio up to the second principal component is 80%. This means that the first and second principal components together explain 80% of the original data.
Visualizing high-dimensional data can be challenging, but if the cumulative explained variance ratio is high for the first two principal components, it is possible to create a two-dimensional scatter plot with minimal loss of information using these components.
Principal Component Analysis in RNA-Seq Analysis
When conducting RNA-Seq analysis, a gene expression table like the following is obtained:

Since each sample contains values equal to the number of genes, the data is highly dimensional. (The image shows data for only 10 genes, but in reality, depending on the species, the number could be in the tens of thousands of genes.)
By performing principal component analysis on this data and plotting it on a two-dimensional scatter plot with the first principal component on the horizontal axis and the second principal component on the vertical axis, it is possible to visualize the similarities between samples. From this plot, it can be inferred that samples 1 to 3 have similar gene expression.
In the plot, the explained variance ratios are indicated in parentheses next to PC1 and PC2. The cumulative explained variance ratio up to the second principal component is 38.57% + 19.55% = 58.12%. Therefore, it can be said that this scatter plot explains 58.12% of the original data.

RNA-Seq Data Analysis Software
This is an RNA-Seq Data Analysis Software recommended for those who:
✔︎ Seeking to avoid outsourcing or collaboration for RNA-Seq data analysis.
✔︎ Lacking time to learn RNA-Seq data analysis.
✔︎ Frustrated by the complexity of existing tools.

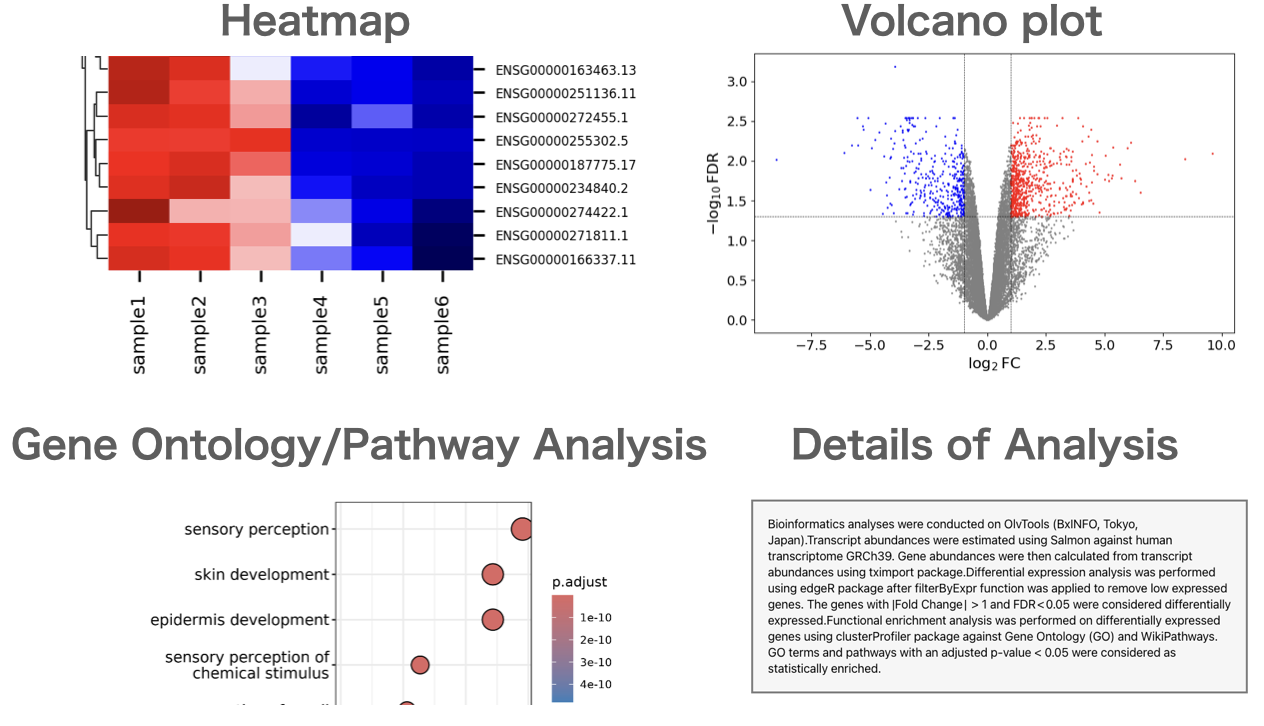
Users can perform gene expression quantification, identification of differentially expressed genes, gene ontology(GO) analysis, pathway analysis, as well as drawing volcano plots, MA plots, and heatmaps.
About the Author
BxINFO LLC
A research support company specializing in bioinformatics.
We provide tools and information to support life science research, with a focus on RNA-Seq analysis.